
|
Python recipes for GIPSY |
Introduction
Important URL's
This recipes page is an addition to the document Programming in Python https://www.astro.rug.nl/~gipsy/pguide/pygipsy.html. where the GIPSY module for Python is documented.That document contains only a few examples and it is not always obvious how to use the functions, methods and classes described there. The recipes are intended as a help to users who want:
- to use Python to write code that calls GIPSY tasks like they did previously with COLA, the COntrol LAnguage for GIPSY. This scripting language has been used as a rapid development environment up to the nineteen eighties to write utilities and small test programs for starting a sequence of GIPSY applications. The Python binding is much more powerful than COLA.
- With the GIPSY module one can access data and header information very easily. One can use all available Python modules your Python installation provides. Therefore it is easy to build a powerful GIPSY task entirely in Python. So Python is one of the languages used to write GIPSY tasks. The others are still C, Fortran and Sheltran.
The recipes are documented examples. The examples all need the GIPSY Python module and start with an import statement like:
from gipsy import *or
import gipsyThe functions and classes of the GIPSY module are documented in:
https://www.astro.rug.nl/~gipsy/pguide/pygipsy.html.
Note that the recipes work for Python 2 and Python 3. For Python 3 you need to install the GIPSY version that supports Python 3.
First steps
A GIPSY task cannot be run from the command line but must be started in the user interface called Hermes, the GIPSY task manager. Assuming you installed the Python binding for GIPSY, copy the next example to a file. Save it to disk using an arbitrary file name. The extension .py is not necessary.
hello1.py
#!/usr/bin/env python
from gipsy import *

init()
anyout("GIPSY")
finis()
|
Assume you called your task myprogram.
Make sure that the script is executable (chmod u+x myprogram).
Start GIPSY as usual (i.e. start Hermes, the user interface) type the
name of the task and press Enter as if it was a regular GIPSY task.
Tasks without keyword interaction: batch jobs
For jobs that don't need keyword interaction (e.g. batch jobs) you can also start your task via ngipsy at the Unix prompt. Output will be appended to the file GIPSY.LOG in the directory where you started your application. Example:ngipsy myprogram
About the recipe
GIPSY scripts written in Python always need a SheBang line otherwise you cannot make it executable in the GIPSY environment. The next line is to import all the GIPSY module functionality in the current name space. The function init() is to connect to Hermes where all the tasks are started and logged. The function anyout() is a module function that writes text to the Hermes Log- and/or Screen file. The syntax for the Python call to this function, can be read in https://www.astro.rug.nl/~gipsy/pguide/pygipsy.html. There we read that it isanyout(text, dev=0)So we learn that text is a required argument and dev is a keyword argument with a default and obviously a number. But the documentation does not tell us what the value of dev should be. So we need the documentation of the function itself. This needs a search action on the GIPSY home page at https://www.astro.rug.nl/~gipsy There we set the search option to dc2 and type anyout in the search bar. You will find the link: https://www.astro.rug.nl/~gipsy/sub/anyout.dc2 which shows you what the meaning is of the numbers for dev.
Finally we need to disconnect Hermes with function finis(). Note that Python code after the finis() call will not be executed because this routine includes an implicit exit.
Note that you can avoid problems with name spaces if you import GIPSY functionality in a different way:
hello2.py
#!/usr/bin/env python
import gipsy

gipsy.init()
gipsy.anyout("GIPSY")
gipsy.finis()
|
How to get help
If you need more information about GIPSY's Python binding, you can consult the documentation at https://www.astro.rug.nl/~gipsy/pguide/pygipsy.html.In this documentation you will encounter references to dc2 documents. These are documents which describe GIPSY functions for programmers. They can be found in your GIPSY tree (\$gip_sub).
Questions can also be mailed to: gipsy@astro.rug.nl
Starting and controlling GIPSY tasks
Starting existing GIPSY tasks
The primary goal of introducing Python for GIPSY was to offer a flexible alternative for the batch language COLA. The most important functionality of COLA is the possibility to start other GIPSY tasks with predefined keywords. Therefore, the first function we made available in our Python environment was xeq() which does the same thing as the COLA function with the same name.The next example is an application that starts another task (DISK) which is called with a pre-defined keyword (INSET=;). If you are familiar with GIPSY tasks then you will know that a semi colon in a keyword stands for 'enter' and is used to terminate a keyword loop. So with this, rather useless, program you start GIPSY task DISK which will not prompt you with a keyword INSET= because we supply a semicolon (;) so that an Enter action is simulated.
xeq.py
#!/usr/bin/env python
from gipsy import *

init()
xeq("DISK INSET=;")

finis()
|
In the next example we show a more useful application for xeq(). Here we want to create a set with the name aurora. To set the required system of world coordinates, we need to have values for the FITS header items like CRPIXn, CRVALn, CDELTn etc. We used task CREATE to try these values and to get all the required keywords used in CREATE. To create some artificial data, we added a function which depends on RA, DEC and FREQ, the axis names without extension.
xeq_create.py
#!/usr/bin/env python
import os
import gipsy
from time import sleep

gipsy.init()
gipsy.anyout("XEQ() starts task CREATE and create a dummy three dimensional set 'aurora'")
gipsy.anyout("The 3rd axis is Frequency and one can view the channel maps with VISIONS")

setname = "aurora"
if os.path.isfile("./"+setname+".descr"):
   gipsy.anyout("Deleting set %s first..."%(setname))
   gipsy.xeq("DELETE INSET=%s; OK=YES"%(setname))

sleep(1)
command = "CREATE OUTSET=aurora; INSTRUME=WSRT; CTYPE1=RA---NCP; NAXIS1=150; CRPIX1=50;\
           CUNIT1=DEGREE; CRVAL1=45; CDELT1=-0.01;\
           CTYPE2=DEC--NCP; NAXIS2=100; CRPIX2=50; CUNIT2=DEGREE; CRVAL2=30; CDELT2=0.01;\
           CROTA2=0;\
           CTYPE3=FREQ-OHEL; NAXIS3=64; CRPIX3=10; CUNIT3=HZ; CRVAL3=0.14154181994170E10;\
           CDELT3=-.78125E5; DUNIT3=KM/S; DRVAL3=0.1050E04; FREQ0=0.14204057520000E10;\
           BUNIT=W.U.; CTYPE4=; FUNCTION=FREQ*exp(-(RA/50)**2-(DEC/40)**2);"
gipsy.xeq(command)
gipsy.finis()
|
It's a dummy set which is ideal to experiment with. You can view the data with
task VISIONS or SLICEVIEW. We will use it to demonstrate functions
for reading the set data and header.
Most GIPSY tasks will show its axes info as follows:
Set aurora has 3 axes
RA---NCP           from   -49 to   100
DEC--NCP           from   -49 to    50
FREQ-OHEL          from    -9 to    54
Task output
There are a couple of ways to interact as a programmer with Hermes. Function anyout() writes a message to the Hermes log and/or screen file.Function status() writes a message to the Hermes status area (where you see the names of the tasks and the prompts of user input routines)
Function typecli() writes a message to the Hermes command line (where the keywords are written). With this function one can supply a keyword with a text.
In the example below we demonstrate these three functions.
taskoutput.py
#!/usr/bin/env python
from time import sleep

import gipsy as gip
gip.init()
gip.anyout("Task Output test")
gip.anyout("anyout(), status(), typecli()")
gip.status("This is a status message. I wait 5 sec.")
sleep(5)
gip.typecli("This is sent to the Hermes command line")
gip.usertext("Press Enter to stop", default=1)
gip.finis()
|
User interaction
Your application can interact with the user with GIPSY user input routines (see User input documentation). The input syntax is similar to the input routines in C. The values for 'default' are- 0: no default
- 1: default
- 2: hidden
- 4: exact number
usertext()
myvalues = usertext(keyword="INPUT=", message="Enter text string",
                    default=0, defval=None, nmax=None)
Read a text string from the user. nmax is the maximum number of characters
to be returned (default 80 or the length of defval)
userint(), userreal(), userdble()
myvalues = userint(keyword="INPUT=", message=None, default=0, defval=0, nmax=1)
myvalues = userreal(keyword="INPUT=", message=None, default=0, defval=0.0, nmax=1)
myvalues = userdble(keyword="INPUT=", message=None, default=0, defval=0.0, nmax=1)
Read one or more integer/real/double precision numbers from the user. No more that nmax numbers can be given. If no input is given, the value of argument defval will be returned. If nmax=1, a single value will be returned and if nmax>1 a list containing the value(s), even if only one value is given.
For the input options read https://www.astro.rug.nl/~gipsy/hermes/numbers.html
Important Note: The results are returned by a low level routine as a C float and then returned in the calling environment as a Python float. But this is a double precision float. If you enter a number e.g. 10.3 then the double precision representation of this single precision float is 10.300000190734863.
So the advise is to use userdble() for all floating point number input.
userlog()
myvalues = userlog(keyword="INPUT=", message=None, default=0, defval=0, nmax=1)Read one or more boolean values (logicals) from the user. No more than nmax values can be given. If no input is given, the value of argument defval will be returned. If nmax=1, a single value will be returned and if nmax>1 a list containing the value(s), even if only one value is given.
For the input options read https://www.astro.rug.nl/~gipsy/hermes/logicals.html
userchar(), usercharu(), usercharl()
myvalues = userchar(keyword="INPUT=", message=None, default=0, defval=None, width=1, nmax=1)
myvalues = usercharu(keyword="INPUT=", message=None, default=0, defval=None, width=1, nmax=1)
myvalues = usercharl(keyword="INPUT=", message=None, default=0, defval=None, width=1, nmax=1)
Read a list of character strings all-case/uppercase/lowercase from the user. No more that nmax strings can be given and each string can be width characters wide.
If no input is given, the value of argument defval will be returned.
If nmax=1, a single value will be returned and if nmax>1 a list containing the value(s), even if only one value is given.
For the input options read https://www.astro.rug.nl/~gipsy/hermes/characters.html
userangle()
myvalues = userangle(keyword="INPUT=", message=None, default=0, defval=0.0, nmax=1)The userangle() routine is documented in userangle.dc2
Note that all arguments have a default.
userinput.py
#!/usr/bin/env python
from gipsy import *

init()

# Syntax: x = userreal(keyword="INPUT=", message=None, default=0, defval=0.0, nmax=1)
# example 1: All arguments are default.
# Note the difference between the results of userreal() and userdble()

x = userreal()
anyout("Result userreal(): "+str(x))
anyout("Type of result: "+str(type(x)))

x = userdble()
anyout("Result userdble(): "+str(x))
anyout("Type of result: "+str(type(x)))


# example 2: Specify everything
x = userdble(keyword="NUMBER2=", message="Give one value: [10.3]",
             default=1, defval=10.3, nmax=1 )
anyout( str(x) )


# example 3: Specify everything, but in fixed order so that you can omit
# the argument names
x = userdble("NUMBER3=", "Give one value: [10.3]", 1, 10.3, 1 )
anyout( str(x) )


# example 4: Get a list of n numbers. Now 'x' is a list so you can
# index the individual numbers
x = userdble("NUMBER4=", "Give max. 10 values", 1, (1.3), 10 )
anyout( str(x) )
anyout( str(type(x)) )
anyout( "Number = %.12f" % x[0] )


# example 5: Get a list of n numbers. with defaults
x = userdble("NUMBER5=", "Give max. 10 values", 1, (1,2,3,4), 10 )
anyout( str(x) )
anyout( "First Number = %f" % x[0] )

finis()
|
Note that if you allow for an input of more than one number, and you want to supply defaults, the list of defaults needs parentheses even if you supply only one default!
userinput2.py
#!/usr/bin/env python
import gipsy as gip

gip.init()

# Input of text (multiple strings) without default
s = gip.usertext("MYTEXT=", "Enter some text: ", defval="Dummy text")
gip.anyout(s)
gip.cancel("MYTEXT=")

# Input of tekst but a default has been set and returned when enter is pressed
deftext = "My default text"
s = gip.usertext("MYTEXT=", "Enter some text:   [{}]".format(deftext), default=1, defval=deftext)
gip.anyout(s)

# Example: CONTINUE=j YES t  -> [True, True, True]
# Example: CONTINUE=NEE n Fal -> [False, False, False]
b = gip.userlog("CONTINUE=", "Continue with step1, with step 2, step 3?:   [Y, N, Y]",
                 default=1, defval=[True,False,True], nmax=3)
gip.anyout(str(b))
gip.anyout("Type of b: "+str(type(b)))
gip.anyout("b[0]="+str(b[0]))
gip.anyout("Type of b[0]: "+str(type(b[0])))

gip.finis()
|
userinput3.py
#!/usr/bin/env python
import gipsy as gip

gip.init()

S = gip.userchar("WORDS=", "Enter some words (max 4): ", nmax=4)
gip.anyout(str(S))

# Re use the keyword which is not cancelled
S = gip.usercharl("WORDS=", "Enter some words (max 4): ", nmax=4)
gip.anyout("Lowercase version: "+str(S))

S = gip.usercharu("WORDS=", "Enter some words (max 4): ", nmax=4)
gip.anyout("Uppercase version: "+str(S))


gip.finis()
|
userinput4.py
#!/usr/bin/env python
import gipsy as gip

gip.init()

gip.wkey("ANGULAR=120d30m15s")
a = gip.userangle("ANGULAR=", "Enter angular real: ")
gip.anyout(str(a))

gip.wkey("ANGULAR=120 30 15 deg")
a = gip.userangle("ANGULAR=", "Enter angular real: ")
gip.anyout(str(a))

gip.wkey("ANGULAR=12h30m")
a = gip.userangle("ANGULAR=", "Enter angular real: ")
gip.anyout(str(a))

gip.wkey("ANGULAR=12h30s")
a = gip.userangle("ANGULAR=", "Enter angular real: ")
gip.anyout(str(a))

gip.wkey("ANGULAR=4r")
a = gip.userangle("ANGULAR=", "Enter angular real: ")
gip.anyout(str(a))

# Interaction:
gip.cancel("ANGULAR=")
a = gip.userangle("ANGULAR=", "Enter angular real")
gip.anyout(str(a))
gip.anyout("Type of output: "+str(type(a)))


gip.finis()
|
The routine userangle() has a different origin than the other 'user' routines for input of numbers. The implication is that constants and constructions as described in https://www.astro.rug.nl/~gipsy/hermes/numbers.html does not apply to userangle()
Next also demonstrate the use of keyword cancelling and rejecting.Note that the last loop is endless and needs to be aborted with ctrl-C.
cancelreject.py
#!/usr/bin/env python
from gipsy import *

init()

# example 1: Repeat over user input until program agrees with input
# The reject shows a message and cancels the keyword input so it can
# be entered again

ok = False
keyword = "NUMBER1="
while not ok:
   x = userreal(keyword, "Enter a number:", 0, 0, 1)
   anyout( str(x) )
   if x >= 0 :
      ok = True
   else:
      reject( keyword, "Negative value not allowed" )


# example 2: Repeat over user input. Cancel the keyword.
# Note that we are using the default value for the keyword because
# we did not specify the parameter keyword=

attempt = 1
while True:
   v = userreal(nmax=1, default=1, message='Enter number (attempt %d):'% attempt)
   anyout(str(v))
   cancel()
   attempt += 1

finis()
|
User input and applying exceptions
Usually you will extend your program by accepting user input with GIPSY keywords. In many cases you will perform some sort of check on this input. Here is an example that uses Python exceptions to control the flow of a program. You enter a GIPSY Set specification with usertext() and try to open this set with function Set() which creates a so called Set object. If a set exists then this Set object is created. Else, an exception is raised, an error message is returned and printed. The program will be aborted because we supplied level=4 to the GIPSY error function. See also: https://www.astro.rug.nl/~gipsy/pguide/pygipsy.html and look for function error().If you supply an empty name or non existing set, then the output of this program will be "GDSError on line 10."
except.py
#!/usr/bin/env python
from gipsy import *

init()

name = usertext(message="Set name")

try:
   s = Set(name)
except GipsyError, msg:
   error(4,str(msg))

del s

finis()
|
Calling some GIPSY tasks with keyword values
A more useful program is a Python script that will convert a FITS file to a GIPSY set and then display that file. It asks for the name of your FITS file and the name of the GIPSY set. Then it calls the GIPSY task RFITS with keywords to convert the fits file to GDS and it calls the task VIEW to display the result.
fitsviewxeq.py
#!/usr/bin/env python
from gipsy import *

init()

fitsfile = "file000001.mt"             # Set a default name for an fits file
fitsfile = usertext("FITSFILE=",
                    "Enter name of fits file:  [%s]" % fitsfile, defval=fitsfile)

# If the fits file you entered does not exist, then ens this program
# in the GIPSY way e.g. call the 'finis' function
if not os.path.exists(fitsfile):
   anyout(">>>>>>> WARNING: Cannot find %s <<<<<<<<" % fitsfile)
   finis()


# Get a name for a GIPSY set to store the fits data in gds format
outputset = "gipsyset"
outputset = usertext("GIPSYSET=",
                     "Enter name of output set: [%s]" % outputset, 1, outputset)
try:
   s = Set(outputset)
except:
   pass
else:
   s.delete()
   del s


xeq("RFITS AUTO=Y FITSFILE=%s; INFILES=0; OUTSET=%s" % (fitsfile, outputset) )
xeq("VIEW INSET=%s CLIP=" % outputset)

finis()
|
GIPSY sets and subsets
How about input of set and subsets?
GIPSY sets and subsets are described in detail in the document Data Structure. but here we will summarize some definitions.- Data in GIPSY is stored in a so called SET. A set consists of two components: an image component and a descriptor component. These components are stored in separate files, but in GIPSY they are always used together.
- Within a set subsets can be defined. A SUBSET is a part of a set with a dimensionality not greater than the dimensionality of the set.
- A FRAME is a part of a subset.
- Associated with the image data there exists a hierarchical system of DESCRIPTOR (or "header") items. A descriptor item is identified by the combination of its name and its subset identification.
- AXIS PERMUTATION array. Axes in a set have a fixed order. Input of set and subsets returns a list of axis numbers ordered by subset axes followed by the numbers of the 'repeat' axes'. Repeat axes are axes along which the subsets are repeatedly extracted.
Next we show a picture of a Set AURORA with axes x, y and z named by
RA, DEC and FREQ.
In the next example we get the set, subset(s) input with routine usertext and use this input to create the set object. First some input examples:
- AURORA FREQ
Return planes in RA and DEC for each grid on the FREQ axis - AURORA FREQ -10:10
Return planes in RA and DEC for grids -10 to 10 on the FREQ axis - AURORA FREQ 2 4 5
Return planes in RA and DEC for grids 2 4 and 5 on the FREQ axis - AURORA RA 10
Return one plane with axis DEC and FREQ at RA grid 10 - AURORA DEC 5 6 FREQ 10
Return two lines in RA at grids DEC 5, FREQ 10 and DEC 6, FREQ 10 - AURORA RA 5 DEC 5 FREQ 10
Return one pixel at grid RA 5, DEC 5 and FREQ 10
setproperties.py
#!/usr/bin/env python
from gipsy import *

init()
anyout("TASK:"+myname())

xeq("DISK INSET=;")

while True:
   input = usertext("SET=", "Set, (subsets)", default=1, defval=None)
   if input is None:
     break
   cancel("SET=")
   s = Set(input)

   anyout("set opened with: %s" % s.spec)
   anyout("set name       : %s" % s.name)
   anyout("subsets        : %s" % str(s.subsets))
   anyout("axperm         : %s" % str(s.axperm()))
   anyout("Axis in fixed order of set:" )

   for ax in s.axes():
      anyout( "Name = %-10s from %5d to %5d  grid 0 is %10g %-10s" % (
        ax.name, ax.slo, ax.shi, ax.crval, ax.cunit ) )

   anyout("Axis in order of user input:" )
   for a in s.axes( True, 'inside' ):
      anyout( "%s (subset axis)" % a.name )

   for a in s.axes( True, 'outside' ):
      anyout( "%s (repeat axis)" % a.name )

   axn = s.axnum(s.axname(1))
   anyout("Axis number of axis with name {} is {}".format(s.axname(1), axn))
   anyout("Axis origin of this axis is {}".format(s.axorigin(axn)))
   anyout("Size of this axis is {}".format(s.axsize(axn)))

   coordword = s.subsets[0]
   anyout("Coordinate word corresponding to first subset is {}".format(coordword))
   anyout("Dimension of the subset(s) is {}".format(s.ndims(coordword)))
   anyout("Grids from this subset: {}".format(s.grids(coordword)))
   anyout("Grid from this subset for axis number 1: {}".format(s.grid(0, coordword)))
   anyout("Grid from this subset for axis number 1: {}".format(s.grid(1, coordword)))

   gr = s.grids(coordword)
   cw = s.word(gr)
   anyout("Coordinate word for previously found grids is {} (should be {})".\
          format(cw, coordword))

   t = s.type("CRVAL1", 0)
   anyout("Type of FITS item CRVAL1 is {}".format(t))

   keys = s.keys(level=None)
   anyout("First level, keyword in keys is: "+str(keys[0]))
   anyout("First 4 FITS keywords found on any level: {}".format(keys[:4]))

   items = s.items(level=None)
   anyout("First (level,keyword), value in items is: "+str(items[0]))
   anyout("First 4 FITS keywords found on any level: {}".format(items[:4]))

   del s

finis()
|
As a bonus we add a piece of code illustrating the use of the axis permutation array as an alternative to the previous example. It fits in the program body of the example just above the line with del s. The code illustrates the use of the axes permutation method in two modes. First we use it to loop over the axis numbers in the subset to get the axes names. Second we loop over the the so called repeat axes to get the name of the axes along which the subsets are repeated. Note that we showed in the previous example that we do not really need the axis permutation array. The code becomes more clear if you use the axes() method.
setpropbonus.py
   n = s.ndims( subset=True )
   anyout( "dimension of the subsets is: %s" % n )

   # use the axis permutation 'k' to get the axis name
   for k in s.axperm('inside'):
      anyout("subset axis name         : %s" % str(s.axname(k)))
   for k in s.axperm('outside'):
      anyout("repeat axis name         : %s" % str(s.axname(k)))
|
Calculate the mean of subsets using GIPSY input syntax
In the previous example we showed how to obtain a list of coordinate words that represents subsets. Now we want to calculate the mean of the data in these subsets. Looping over subsets can be done with two methods. The method subimage() needs a coordinate word to create a slice of the set data. Its shape is set by the number of axes in the subset and the length of these axes. The other method is called subimages() and is an example of a generator that gets subset data without a coordinate word as a parameter. It is very suitable for looping over subsets.This way we can loop over all subsets and calculate the mean of the data in these subsets using a method mean() that is available to arrays. The recipe shows that we can write a real analysis application with only a few lines of code.
meansubimages1.py
#!/usr/bin/env python
from gipsy import *

init()

s = Set(usertext("INSET=", "Set,subset(s): "))

for subset in s.subsets:
   anyout( "mean of subset" + " = " + str(s.subimage(subset).mean()) )

finis()
|
However if you want to access individual subsets, then you can get slices using the subimage() method, which has a coordinate word as input parameter. Now you don't need to loop over you subsets in a fixed order. Here is the example:
meansubimages2.py
# (due to changes in the gipsy module, this code is now
#  equivalent to the previous example's)
#
for cword in s.subsets:
   subsetslice = s.subimage(cword)
   anyout( "mean of subset" + " = " + str(subsetslice.mean()) )
|
Accessing the properties of a set (II)
In many GIPSY programs one needs to know some properties of the set. In the next example we demonstrate how to access set properties like axis lengths etc. Note that the argument of the range method is '0'. It is a coordinate word that represents the entire set (set level). For accessing header items on set level (=0) you can omit the zero. Header items can be removed from the set using the Python value None.This script also writes some info in the header of the input set. You have to tell this explicitely to the method that opens the set with the parameter
write=True
headerinfo.py
#!/usr/bin/env python
from gipsy import *

init()

s = Set(usertext(message="Setname"), write=True)

dim = s.naxis
anyout( "Dimension of set: %d" % dim )

# Get coordinate words of first data point in set and of the last one
lo, hi = s.range(0)

# Print the axis name and the range in grids for all the axes in the set
for i in range(dim):
   anyout("%s: from %d to %d" % (s.axname(i), s.grid(i, lo), s.grid(i, hi)))

# Print the value of a header item (at set level)
t = s[0, 'INSTRUME']
anyout( str(t) )


s[0, 'OBSERVER'] = 'Me'        # Change the value of a header item.
s['TEMPHEAD'] = None           # Delete item 'TEMPHEAD' on set level (=0)

del s                          # Close the set

finis()
|
Creating a set from scratch
Never has it been so easy to create a set from scratch than with this Python interface. Create the Set object with the parameter create=True and create the axes with the extend() method. Note that the FITS definition sets the first pixel in a sequence to 1. With parameter origin (second argument in extend()) we define the pixel with number origin as grid 0. Grids are a GIPSY definition. When you set an origin to 10, then that pixel is grid 0 and its neighbour to the left is grid -1 and the neighbour to the right is grid +1. Thhe first pixel in the sequence will get grid numer -9.If we require a axis length of 5, the we include grids -9, -8, -7, -6, -5.
So we will see a GIPSY grid range [-9,-5].
Now fill the image associated with the new set with some numbers and as a bonus, extract a plane. Note that attribute image is a NumPy ndarray object so you can apply NumPy (and othe ndarray based) methods to it.
createset.py
#!/usr/bin/env python
from gipsy import *

init()

name = usertext(message="Set name")

s = Set(name, create=True)      # Mode 'create' creates a new set

s.extend("RA",   10, 5)         # Create an axis. Parameters: Name, origin and length
s.extend("DEC",  15, 4)
s.extend("FREQ",  0,  3)

i = s.image                     # Now you can create its data
anyout( str(s.slo) )
anyout( str(s.shi) )

i[:] = range(5)                 # Fill with numbers

x = i[1,:,]                     # Get a slice

anyout(str(x))
anyout(str(x.shape))

del s

finis()
|
Calculate the mean of subsets in a set, an alternative method
This example is written for a 3d cube and we want a list of the mean values of the data in the subsets without using the GIPSY syntax for the specification of subsets i.e. we extract the data from the cube directly. If we create the set object 's' we can access all its data in the 'image' member which is a multidimensional array with the right shape. Note that in Python the first array index corresponds to the last axis in the GIPSY subset. Array slicing is used to get separate subsets (for a GIPSY RA-DEC-FREQ cube, these are the subsets with RA and DEC axis).
meanwithoutsubsets.py
#!/usr/bin/env python
from gipsy import *

init()                  # Contact Hermes

# Get the name of the GIPSY set by prompting with a default keyword INPUT=
name = usertext(message="Set name")

s = Set(name)           # Create set object s

i = s.image             # Extract the image part of the set object

k = i.shape[0]          # Length of first element = last axis

# Loop over all subsets
for j in range(0,k):
   m = i[j]             # Extract a subset along the last axis. Note that
                        # i[j] is an abbreviation of the array slice i[j,:,:]
   me = m.mean()        # Get the mean of this subset

   anyout( "mean of channel "+str(j)+" = "+str(me) )


del s                   # Release the object

finis()                 # Disconnect Hermes
|
Writing data to an existing set
Writing data to a set directly is easy. The Set object has an image part with the right dimensions. If we have a three dimensional data cube with dimensions 1024x512x64 then a matrix M has indices M[0..63, 0..511, 0..1023] In Python you can use some shortcuts to address rows, planes or the entire cube. In the next example we use the M[:] notation to set the entire input set to a value entered by the user. Do not forget to tell the set object that it is allowed to change its image data.
writedatatoset.py
#!/usr/bin/env python
from gipsy import *

init()

name = usertext(message="Set name")

s = Set(name, write=True)

i = s.image

val = userreal("value=", "Enter value to fill set")
anyout( str(val) )

# Entire set is set to this value
i[:] = val

del s
finis()
|
Defining a frame (box input)
We defined a frame as a part of a subset. If you refer to a subset as a slice through your data, then it easy to imagine that it can be useful to have a method that defines a part of this subset. GIPSY users recognize the input of a box. Before you can enter a box, a set object needs to be created, because a box is related to a set. Only then you can enter a box in physical coordinates. Read more about box input in Specifying a frame in the programmers guide. The setbox method of the set object has a string as input parameter. This string contains the definition of the box, in this case entered by the user with usertext.Before the box method is used, the set has two attributes blo and bhi which contain the coordinates of the entire subset. After the setbox method these values are changed to what was specified in its argument, in this case a string, entered with usertext. As explained before, the subimage() method extracts a data slice from the set. The method has an extra argument box=True or box=False. The first is a default. Then any slice (=frame) will have the limits as set by the box input. Otherwise, (with box=False) you get the entire slice. Below the example source, we will describe the code in detail. The program is an endless loop which can be aborted with ctrl-C.
boxtest.py
#!/usr/bin/env python
from gipsy import *

init()

s = Set(usertext("SET=", "Set, subset"), write=True)
anyout("blo= %s, bhi= %s" % (s.blo, s.bhi))

while True:
   b = usertext("BOX=", "Give box", defval='', default=1)
   cancel("BOX=")
   s.setbox(b)
   i = s.subimage(s.subsets[0])
   anyout(str(i.shape))
   anyout("blo= %s, bhi= %s" % (s.blo, s.bhi))
   v = userreal("VALUE=", "Give value")
   i[:] = v

finis()
|
The program prompts the user for a set and subset. It creates the set object s (allowing to change its data with write=True and prints the tupels that correspond to the grid limits of the entire set. Then it starts a loop. In this loop, the user is prompted for a box. The user enters a box and an array with image data corresponding to the subset is created with method subimage(). Then the user is prompted for a data value and then all pixels in the box are set to this value. You can check the result by starting task SLICEVIEW to display your subset. If you press its reload button after you entered box and value it will display the new result. Be aware of the fact that your set is changed so make a copy of it first if you want to keep the original.
Here are some examples related to box input:
| PC | projection centre, effectively grid position (0,0,...,0). |
| AC | axis centre. If the length of axis i is NAXISi and the reference pixel is CRPIXi, then the i-th coordinate is given by the expression NAXISi / 2 - CRPIXi. |
| BOX= -3 -3 4 4 | specifies a 2-dimensional frame containing 64 pixels from lower left to upper right |
| BOX= PC D 8 8 | box with size 8x8 pixels with PC as center |
| BOX= * 3 0 0 * 45 0 0 D 6 arcmin 6 arcmin | box centered at 3h0m0s and 45d0m0s with sizes in RA and Dec of 6 minutes of arc. The units of the sizes must be compatible with the axis units in the header of the set. |
Practical examples with set aurora
If we use set aurora created with script xeq_create.py as input set, then we can check how the input of a box should work.Remember the following axis information of this data set:
Set aurora has 3 axes
RA---NCP           from   -49 to   100
DEC--NCP           from   -49 to    50
FREQ-OHEL          from    -9 to    54
program: boxtest.py
key:     SET=aurora
key:     BOX=-10 -10 0 10 10 0
output:  blo= [-10, -10, 0], bhi= [10, 10, 0]
The set was entered without repeat axes. So in fact there is one subset and that is the entire data cube. Then we need to specify a 3D position for the lower corner and a 3D position for the upper corner.
program: boxtest.py
key:     SET=aurora freq
key:     BOX=-3 -10 20 30
output:  blo= [-3, -10], bhi= [20, 30]
The set input was given as a series of subsets. They are RA-DEC subsets repeated along the FREQ axes. Then we need to specify a 2D position for the lower corner and a 2D position for the upper corner.
program: boxtest.py
key:     SET=aurora ra 0 dec 0
key:     BOX=30 50
output:  blo= [30], bhi= [50]
Here the two repeat axes are RA and DEC. At grids RA=0 and DEC=0 a line is defined in the direction of FREQ. The corners of this subset are therefore 1-dimensional.
program: boxtest.py
key:     SET=aurora ra 10
key:     BOX=-30 0 30 10
output:  blo= [-30, 0], bhi= [30, 10]
The set input defined one subset at RA=10 and its axes are therefore DEC, FREQ. So now we need to specify the corners in DEC, FREQ.
program: boxtest.py
key:     SET=aurora freq 20
key:     BOX=PC D 10 5
output:  blo= [-4, -2], bhi= [5, 2]
We defined a subset with RA, DEC axes at FREQ=20. This is a map with two spatial axes and we can apply some shortcuts. For instance, we can define the grids corresponding to the projection center with PC. This becomes the center of a box with sizes defined in D 10 5.
program: boxtest.py
key:     SET=aurora freq 20
key:     BOX=AC D 10 5
output:  blo= [22, -1], bhi= [31, 3]
Instead of the grids of the projection center, one can also want to have the center of the map as the center of a box. This center is defined with AC.
program: boxtest.py
key:     SET=aurora freq 20
key:     BOX=AC D 6 arcmin 12 arcmin
output:  blo=[-4, -9], bhi= [5, 10]
Instead of defining the axis lengths in grids, we can also give them in world coordinates by adding a unit. For our set aurora, we know that the grid spacing is 0.01 degree in each direction. So we expect a box with a length of 10 grids in RA and 20 grids in DEC.
program: boxtest.py
key:     SET=aurora ra 0 dec 0
key:     BOX=1700 km/s 1900 km/s
output:  blo= [39], bhi= [51]
In this one dimensional subset along FREQ we enter the (1 dimensional) corners of the box in world coordinates. In this case they are velocities because the header of this set defines the transformation from frequency to velocituy.
program: boxtest.py
key:     SET=aurora freq 20
key:     BOX=* 3 0 0 * 30 0 0 D 20 10
output:  blo= [-9, -4], bhi= [10, 5]
Now we entered the center of our required box with (legacy) GIPSY world coordinates. Below are the options one can use to specify a position in sky coordinates.
 *        for RA or DEC in resp. HMS and DMS in EPOCH of set
 *1950    for RA or DEC in resp. HMS and DMS in EPOCH 1950.0
 *xxxx.x  for RA or DEC in resp. HMS and DMS in EPOCH xxxx.x
 G        Galactic longitude or latitude in degrees
 E        Ecliptic longitude or latitude in degrees
 S        Supergalactic longitude or latitude in degrees
In the example above we defined a line in the direction for FREQ at RA=0 and DEC=0. Along this one dimensional subset, we can enter a box in world coordinates, for example in km/s.
Writing history to a set header
It is useful to store some text in a set header to describe how a set was changed or used. There are two methods to write such information. In the next examples the whistory() method is once called without parameters. Then it writes the current date and time and the current task parameters to history in the descriptor of the set at top level. If you specify a string, then only that string is stored. The wcomment() method is used if you want to store comments.
historytest.py
s.whistory()
s.whistory('GIPSY (C) 2003')
s.wcomment('Processed on Albirumi')
|
A small program to copy data to a new set
Lets write a program that reads data from an input GIPSY set, processes this data and writes the result to a new set. As an bonus we want to manipulate the data as function of the data value and the position in the box.Then we need to solve the a couple of problems:
- Create a useful default string for the BOX keyword
- Create an output set with the same properties as the input
- Create a loop over all the subsets in the input set and write the manipulated data to the corresponding subsets in the output set
- Convert the grid positions to positions in the array
It is possible to access image data in a loop using the
shape of the array in which the data is stored. For a N x M
array the first element is accessed by array[0,0] and the last element
by array[M-1,N-1] (i.e. index of 'fastest' axis is last). Now it is
possible to loop over all positions in x and y and retreive the
pixel value at that point. Using an expression entered by the user,
we use Python's eval function to calculate a new pixel value
as function of its position and previous pixel value.
Test the progam with e.g. EXPR=x+y+data.
Note that the dimension of the input must be a 2-dimensional (sub)set.
The program does not check that your input has the right dimensionality.
copyset.py
#!/usr/bin/env python
from gipsy import *

init()
setin = Set(usertext("INSET=", "Set, subset:"))
anyout("flo= %s, fhi= %s" % (setin.slo, setin.shi))

# Prepare to enter a box

boxmes = 'Enter box in '
for k in setin.axperm('inside'):
    boxmes += str(setin.axname(k)) + ' '
boxmes += '   [entire subset]'
b = usertext("BOX=", boxmes, defval='', default=1)
setin.setbox(b)
anyout( "blo=%s bhi=%s" % (setin.blo,setin.bhi) )

outname = usertext("OUTSET=", "Name of output set: ")
setout=setin.copy( outname )

userexpr = usertext("EXPR=", "Enter expression f(x,y,data): ")

# Start to loop over all subsets. You need both the coordinate words
# of the input set and the output set.

for s in range( len(setin.subsets) ):
   Min  = setin.subimage(setin.subsets[s])
   Mout = setout.subimage(setout.subsets[s])

   for y in range(setin.blo[1],setin.bhi[1]+1):
      iy = y - setin.blo[1]
      for x in range(setin.blo[0],setin.bhi[0]+1):
         ix = x - setin.blo[0]
         data = Min[iy,ix]
         Mout[iy,ix] = eval(userexpr)

   setout.wminmax(setout.subsets[s]) # Update header items DATAMIN,DATAMAX,NBLANK

setout.whistory()                    # Save history to header
del setin
del setout

finis()
|
GIPSY module IOUTILS for enhanced user input
WCSINP for input of GIPSY datasets or FITS files
The above sections describe a way to enter a GIPSY Set with the constructor of the GIPSY Set class Set(). A specification for the data (e.g. for the subsets) is prompted with usertext(). A more sophisticated way to enter this information is with function wcsinp() from GIPSY's IOTILS module. This routine can require a dimension of the entered subsets and when this condition has not been met, a prompt appears to enter axis names. The routine can also deal with FITS files directly using the same syntax as opening a GIPSY (GDS) data set. It also supports reading FITS files over the Internet using an URL. An object read with wcsinp() has all the properties as the object created with Set() but it has more properties and these contain information about the World Coordinates System (WCS) of the input data. The description of input arguments and object attributes can be found in https://www.astro.rug.nl/~gipsy/sub/wcsinp.dc2
ioutilswcsinp.py
#!/usr/bin/env python
import gipsy as gip
import ioutils

gip.init()
myset = ioutils.wcsinp(requireddim=2)
myset.printinfo()
s = "You opened this set with:  " + myset.spec
gip.anyout(s)
s = "Is the data structure you selected a spatial map? " + str(myset.spatialmap)
gip.anyout(s)
s = "Is a missing spatial axis found? Index (0 relative) or None: " + str(myset.mixax)
gip.anyout(s)
s = "The 1 based axes numbers in the Projection object used for coordinate transformations: " + str(myset.projaxnum)
gip.anyout(s)
gip.finis()
|
For programmers, it is important to understand the output of attribute projaxnum. If you entered a two dimensional subset with one spatial and one spectral axis for example, then wcsinp tries to find a missing spatial axis and the number of axes in the attribute projaxnum will be 3. Also the numbers are numbers in the interval [1,N]. To summarize the use of axis numbers:
- GIPSY defines axis numbers in the interval [1,N], just like FITS (CRVAL1, CDELT3 etc.)
- The GIPSY Python module uses axis numbers in the interval [0,N-1]. The idea is that they can be used as array indices then The WCS module from the Kapteyn Package uses axis numbers in the interval [1,N] because that is what the library WCSLIB is using to accomodate the FITS definition of axis numbers.
WCSBOX for setting the grid limits
When a data structure (FITS or GDS) has been read with wcsinp(), we can use method wcspos() to prompt the user to enter the grid limits of the data set. In GIPSY we call this a box. Usually this is prompted with keyword BOX=. The wcspos() is much more advanced than the setbox from the GIPSY Python module. With the example below one can enter a BOX with for example: A spatial map with axes R.A. and Dec:BOX0= -20 -20 20 20 # box from (x,y)=(-20,-20) to (x,y)=(20,20) BOX0= 0 0 D 30 30 # box centered on (x,y)=(0,0) with size 30x30 pixels BOX0= pc D 30 30 # box centered on projection center (CRPIX) BOX0= 0 0 D 1 arcmin 1 arcmin # box with sizes corresponding to 1 arcmin BOX0= 20h10m30s 12d34m18s D 10 10 # center given in sexagesimal notation BOX0= 162.234 deg 28.234 deg D 10 10 # center given in header compatible unitsFor a velocity profile at e.g. RA 0 and DEC 0:
BOX=0 km/s 140 km/s
ioutilswcsbox.py
#!/usr/bin/env python
import gipsy as gip
import ioutils


gip.init()
myset = ioutils.wcsinp()
myset.printinfo()
blo, bhi = myset.wcsbox()
s = "The grid limits of your data run from: "+str(blo) + " to " + str(bhi)
gip.anyout(s)
gip.finis()
|
More details about the arguments in this method, you find in https://www.astro.rug.nl/~gipsy/sub/wcsbox.dc2
More examples of (world) coordinate specifications can be found in: https://www.astro.rug.nl/software/kapteyn/positions.htmlSETWCSBOX, WCSPOS
See docs in:Coordinates
Definitions
In GIPSY we have different coordinates. Here are the definitions.- File coordinates, which are directly related to the position in the image file. In GDS file coordinates are often represented as coordinate words. A COORDINATE WORD is an integer value into which the position of any subset (pixels, lines, planes etc.) can be coded.
- GRID COORDINATES, related to the position with respect to the symbolic axes
- PHYSICAL or astronomical COORDINATES
Converting grid coordinates to physical coordinates
Many times a GIPSY application needs to know the physical value that correspond to a location in grid coordinates. For example you want to know what the RA and DEC are in a RA-DEC subset at coordinate 0,0. Or you want to know the physical coordinate on the repeat axis/axes for the current subset in a loop. The next code is a recipe for converting a grid position in a subset to a physical value and to convert the grid position of the subset on the repeat axis (or axes) to a physical value.What are these physical values? In the header of the GIPSY set you find header items that define a physical coordinate system. Item CRPIX indicates which pixel along an axis is grid 0. CRVAL is the physical value that corresponds to this grid 0 in units given by CUNIT. Then you need a step size CDELT which is a size in physical coordinates of one pixel. Finally you need a sky system and a projection system or something similar to do proper transformations. The projection is read from header item CTYPE (e.g. RA-NCP).
Lets introduce two new methods for the transformation between grid coordinates and physical coordinates. First is tophys which converts grids to physical coordinates annd second togrid which transforms physical coordinates to grids. The methods accept a number of parameters: a coordinate tupel, a coordinate word and a mode which can have values 'inside' and 'outside'. This mode determines what is transformed, either the coordinates inside the subset or coordinates outside the subset, i.e. the coordinates along the repeat axis/axes. For the last option you need to specify the grid coordinate also because the information about the repeat axes is stored not completely stored into the coordinate word if the repeat axis needs a matching axis. For example, given our RA-DEC-FREQ cube aurora we can specify subsets as: INSET=aurora dec -10:10 Then the grids along the repeat axis (dec) are extracted from the coordinate word, but it need a matching RA (otherwise a default is taken) to be able to transform to physical coordinates. This all is reflected into the two lines:
   p = s.tophys( x, cword, 'inside' )
   po = s.tophys( x, cword, 'outside' )
The routines are based on the C-function COTRANS but are much more comfortable to use because you don't need to bother about axis permutations as you should have done when you used COTRANS. Basically our next recipe has the same functionality as the GIPSY task COORDS.
In the recipe we present two methods to get the grid on a repeat axis that represents the position of the subset. In C we used to find this position using the axis permutation array and a grid function that converts a coordinate word to a grid. The second method uses the axes() method to get the properties of an axis. One of its attributes is 'blo' which represents the lower limit of a box in a subset or the grid position of a subset for a repeat axis (then also blo == bhi). But the method needs a coordinate to do the right conversion.
cotrans.py
#!/usr/bin/env python
from gipsy import *

init()

input = usertext("SET=", "Set, (subsets)")
s = Set(input)

ndim = s.ndims( subset=True )
x = userdble( "GRIDS=", "Enter position in subset (%d numbers): " % ndim, nmax=ndim )
anyout( "grid = %s" % str(x) )

axnames = ''
for a in s.axes( True, 'inside' ):
   axnames += a.name + '(s) '

for a in s.axes( True, 'outside' ):
   axnames += a.name + '(r) '

anyout( axnames )

for cword in s.subsets:
   p = s.tophys( x, cword, 'inside' )
   po = s.tophys( x, cword, 'outside' )

   #  Get the grids of the position of the subset on the repeat axes
   #  Method 1, use axis permutation array and grid() method
   #  st = ''
   #  for k in s.axperm('outside'):
   #     st += str(s.grid(k,cword))+ ' '

   # Method 2, use the axes() method for this subset. The repeat axes
   # need a coordinate word.
   st = ''
   for a in s.axes( cword, 'outside' ):
       st += str(a.blo) + ' '


   anyout( "%s repeat: (%s)=%s" % (str(p), st, str(po)) )

del s


finis()
|
Tables, columns and rows
Introduction
A GIPSY table resides in a GDS set. A set can contain as many tables as necessary and every table can contain as many columns as necessary. Columns can be created and deleted at any moment. For programmers details about tables see: GIPSY Table documentation.There are 4 examples to illustrate the use of the table methods. The first example describes how to create a table.
createtable.py
#!/usr/bin/env python
from gipsy import *

init()

s = Set(usertext("set=",message="Setname"), write=True)
t = usertext("tab=",message="Table name")
c = usertext("col=",message="Column name")

# Create the column and prepare to store numbers of type DBLE.
s.crecol(t, c, "DBLE")

finis()
|
Writing column data
In the second example we demonstrate how you store some data in a column.
writecolumn.py
#!/usr/bin/env python
from gipsy import *

init()
# Get set name, table and column name
s = Set(usertext("set=",message="Setname"), write=True)
t = usertext("tab=",message="Table name")
c = usertext("col=",message="Column name")

# Get some doubles from user
data = userdble("data=", message="data", nmax=20)

# Write the data to that column at set level (0) and
# do not append but start writing at the begin.

s[0, t, c, :] = data

finis()
|
List the columns of a given table in a set
Assuming you know the table name (and level), this example shows how to obtain the name of the columns in that table.
listcolumns.py
#!/usr/bin/env python
from gipsy import *

init()

set   = Set(usertext("set=",message="Setname"))
table = usertext("tab=",message="Table name")

cols = set.tabinq(table)

for col in cols:
   ctype, ccomm, cunts, rows = set.colinq(table,col)
   anyout("%s: Type= %s, Comment= %s, Units= %s Rows = %d"
        % (col,      ctype,       ccomm,     cunts,    rows) )

finis()
|
Reading the data in a column
The next step is to display all the data in a column, given the set and th name of a table. In this example we get the data of a table on set level (0).
readingcolumndata.py
#!/usr/bin/env python
from gipsy import *

init()

s = Set(usertext("set=",message="Setname"))
t = usertext("tab=",message="Table name")
c = usertext("col=",message="Column name")


for l in s[0,t,c,:]:
   anyout(str(l))

finis()
|
Finally we present a small program that demonstrates how to find tables, read columns and delete tables.
table.py
#!/usr/bin/env python
import gipsy
import numpy

gipsy.init()


setname = gipsy.usertext("INSET=", message="Enter set name")
myset = gipsy.Set(setname, write=True)

# Let's write a new table and column first to append to the header
tabname = "AMIGA"
colname = "ID"
coltype = 'DBLE'
subset = 0
myset.crecol(tabname, colname, coltype, subset=subset) #, colcomm="Just testing", colunits="kHz")
data = numpy.linspace(0,10)
myset[subset, tabname, colname, :] = data


# Generate a list of tables. This routine will find ALL tables, i.e.
# it does not depend on the given subset level
# So with 'tablis', you will find different subset levels. They are not
# necessarily the same as the subsets you entered with INSET=
# This is kind of a pitfall. If you need to access tables on a certain
# subset level, you have to filter (see next section)

# 'tablis' needs a maximum. The default is 100 (it is a C routine which uses
# dynamic memory allocation. If there are more
# than 'maxtables', we try again with an increased number
maxtables = 200
attempts = 0
while attempts >= 0:
   try:
      tablist = myset.tablis(nitems=maxtables)
      attempts = -1
   except:
      maxtables += maxtables/2
      attempts += 1

# Now filter the table list on subset levels
filteredtables = []
for tabl in tablist:
   tablename, subset = tabl
   s = "Found %s at level %d"%(tablename,subset)
   gipsy.anyout(s)
   if subset in myset.subsets:
      filteredtables.append(tabl)

# Sort on subset first and then on name
from operator import itemgetter
sortedtables = sorted(filteredtables, key=itemgetter(1,0))

gipsy.anyout("Tables on the required subset level(s):")
for tnam, tlev in sortedtables:
   gipsy.anyout("%s   (%d)"%(tnam,tlev))


# For all the tables, get the information about its columns
for tabl in sortedtables:
   tablename = tabl[0]
   subset = tabl[1]
   gipsy.anyout("\nTABLE: %s"%tablename)
   cols = myset.tabinq(tablename, subset=subset)      # Get the columns for this table at this subset level
   s = "%10s %10s %10s %10s %-20s" % ("Columns", "Type", "Units", "Rows",  "Comment")
   gipsy.anyout(s)
   gipsy.anyout("="*len(s))
   for col in cols:
      ctype, ccomm, cunits, rows = myset.colinq(tablename, col, level=subset)
      gipsy.anyout("%10s %10s %10s %10d %-20s" % (col, ctype, cunits, rows, ccomm))


# Let's assume we want the contents of all the columns in table with index 0
if len(sortedtables) >= 1:
   table = sortedtables[0]
   tablename, subset = table
   gipsy.anyout("\n\nContents of table %s:" % tablename)
   cols = myset.tabinq(tablename, subset=subset)
   for col in cols:
      rows = myset[subset, tablename, col, :]
      gipsy.anyout("%s = %s" % (col, str(rows)))


key = "DELTAB="
mes = "Enter name of table to delete ... [skip deleting]:"
tablename = gipsy.userchar(key, mes, default=1, defval="")

if tablename:
   # Find this name in the list of table tuples
   deltabs = [x for x in sortedtables if x[0]==tablename.upper()]
   if deltabs:
      tname, subset = deltabs[0]
      myset.deltab(tname, subset)
      gipsy.anyout("I deleted table [%s] at subset level [%d]"%(tname,subset))
   else:
      gipsy.anyout("Did not find this table to delete!")

key = "DELTABLIST="
mes = "Delete all tables in given subset(s) ... Y/[N]:"
deltablist = gipsy.userlog(key, mes, default=1, defval=False)
if deltablist:
   for tablename, subset in sortedtables:
      myset.deltab(tablename, subset)

key = "DELALLTAB="
mes = "Delete all tables on all levels ... Y/[N]:"
delalltab = gipsy.userlog(key, mes, default=1, defval=False)
if delalltab:
   for tablename, subset in tablist:
      myset.deltab(tablename, subset)


gipsy.finis()
|
Plotting
With the introduction of Python for GIPSY around 2001, we decided to try to be independent of external Python modules as much as possible. This was well before the arrival of modules like NumPy, Scipy and Matplotlib and PyQT. The only way to plot was with PGPLOT. We wanted a more flexible way of plotting and developed KPLOT (the Kapteyn Plot module). But as soon we saw how Matplotlib was developping, we left the Kplot track and started to use Matplotlib. This package makes it very easy to plot data as an image or with contours.Plot an image of a 2d GIPSY (sub)set
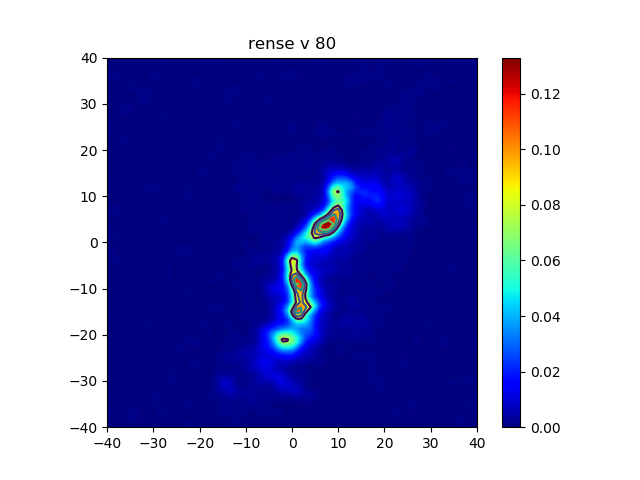
In the following code we extract data from a GIPSY set and plot it with Matplotlib. To be able to plot the correct grids along the axes, we use argument extent in both the methods imshow() and contour().Note that plotting world coordinates is not possible in this context. For those, we use the Kapteyn Package, for which we wrote a number of tutorial pages at https://www.astro.rug.nl/software/kapteyn/ (see section 'Tutorials').
plotimage.py
#!/usr/bin/env python
import gipsy
import numpy as np
from matplotlib.pyplot import figure, show


gipsy.init()

# Get GIPSY set and enter box
setspec = gipsy.usertext("SET=", "Set, 1 subset:")
s = gipsy.Set(setspec)
gipsy.anyout(gipsy.myname()+": "+"flo= %s, fhi= %s" % (s.slo, s.shi))

# Use GIPSY way to end program if dimensionality is wrong
if s.ndims(subset=True) != 2:
   gipsy.error(4, "Subset must be 2-dimensional")

boxmes = 'Enter box in '
for a in s.axes(True, 'inside'):
   boxmes += a.name + ' '
boxmes += '   [entire subset]'

b = gipsy.usertext("BOX=", boxmes, defval='', default=1)
s.setbox(b)
gipsy.anyout(gipsy.myname()+": "+"blo=%s bhi=%s" % (s.blo,s.bhi))

cw = s.subsets[0]        # Coordinate word
defval = None
prompt = "Enter max. 10 levels between (%g,%g):    [calculated]" %\
          (s[cw,'datamin'], s[cw,'datamax'])
levels = gipsy.userreal("LEVELS=", prompt,
                        default=1, defval=defval, nmax=10)

# Get the image data from this subset
M = s.subimage(cw)

# Artificial levels for contours
if defval is None:
    levels = np.linspace(M.min(), M.max(), 10)[-5:]

# The plot with Matplotlib
fig = figure()
ax = fig.add_subplot(1,1,1)
extent=(s.blo[0], s.bhi[0], s.blo[1], s.bhi[1])
im = ax.imshow(M, interpolation='bilinear', cmap='jet',
                  origin='lower', extent=extent,
                  vmin=0.0, vmax=M.max())
fig.colorbar(im, ax=ax)
ax.contour(M, levels=levels, extent=extent)
ax.set_title(setspec)
show()

# Show is over, cleanup set object and disconnect from Hermes
del s
gipsy.finis()
|
Use existing task GPLOT to create plots
As an alternative to Kplot you can use the PGPLOT based facilities provided by the GIPSY task GPLOT. GPLOT is still intensively used by GIPSY users and especially this group will benefit by using Python to write GPLOT input files. The next recipe is an example how you can build and use a GPLOT input file. In the recipe pages of GPLOT you will find numerous examples of GPLOT input files. GPLOT has only one important keyword (COMMAND=) which accepts GPLOT commands. These commands can be stored in a text file and executed all together withGPLOT COMMAND=input myfile.txtor with some other file name. You can close GPLOT with
COMMAND=quitIf we combine these to entries in a call to the xeq function then we get in Python:
gipsy.xeq( "GPLOT COMMAND=input %s;quit" % name )and name is the name of your GPLOT input file on disk. We choose to create an unique file name with
name = tempfile.mktemp(dir='.')which creates a file name that is unique in the current directory. A class 'Gplot' hides the complexity of this by defining some methods so you can concentrate on the second par of the code. You add a GPLOT command to a list with method addcommand(). If you want to plot the result then call method plotondevice(). This method has two arguments. The first is 'device'. This is a string that represents the GPLOT device (X11 = default, PCPSFILE, LCPSFILE etc.). The second is a filename. If omitted a temporary file is created in which the GPLOT commands are stored. After executing GPLOT, the file is removed from disk. If you entered a file name then a file with that name is created and it is NOT removed afterwards so you are able to inspect it or use it directly as input file for GPLOT. First we show you the code of the Gplot class.
Gplotclass.py
#!/usr/bin/env python
import gipsy


import os
import tempfile
class Gplot:
   """
------------------------------------------------------------------
Example of a class to facilitate the use of an existing
GIPSY task. In this example we made methods for
writing and executing a GPLOT input file (see GPLOT documentation
in GIPSY)
Methods:
Gplot.addcommand( str ) : str is a string which represents a Gplot
                          command.
Gplot.plotondevice( device, gplotinputfile ): device is a string
                          representing a valid GPLOT device (X11,
                          PCPSFILE etc.). gplotinputfile is a
                          file name. If omitted, a tempory file
                          is created else a file with the given
                          name is kept on disk.
------------------------------------------------------------------
"""
   def __init__( self ):
      self.commandlist = []
   def addcommand( self, command ):
      self.commandlist.append( command )
   def plotondevice( self, device="X11", gplotinputfile = '' ):
      if gplotinputfile == '':
         name = tempfile.mktemp(dir='.')       # Get a unique name for a file
         remfile = True
      else:
         name = gplotinputfile
         remfile = False
      f = open( name, 'w' )
      f.write( "device %s\n" % device )
      for com in self.commandlist:
         f.write( com + '\n' )

      f.close()

      # Start GPLOT and load the input file. Provide the COMMAND=
      # keyword with value 'quit' to finish GPLOT.

      gipsy.xeq( "GPLOT COMMAND=input %s;quit" % name )

      if remfile:
         os.remove( name )                     # Remove the file from disk
|
A set, subset is asked and the program checks whether the dimension of the set is 2. If not then the program is aborted with GIPSY function 'error'. The minimum and maximum data values are read from the header of the (sub)set and used in a prompt to get the values for the wanted contour levels. Note that we store the input in a string and not in an array of reals using userreal as input function.
gplot.py
#!/usr/bin/env python
import gipsy
from Gplot import *


gipsy.init()

# For a PostScript file, write something like PCPSFILE/myfile.ps
defdev = "X11"
dev = gipsy.usertext( "DEVICE=", "Enter device:  [%s]" % defdev, 1, defdev )

setname = gipsy.usertext( "INSET=", "Enter set, subset", 0 )
s = gipsy.Set( setname )

# Use GIPSY way to end program if dimensionality is wrong
if s.ndims( subset=True ) <> 2:
   gipsy.error(4,str("Subset must be 2-dimensional"))

cw = s.subsets[0]
levels = gipsy.usertext( "LEVELS=", "Enter <10 levels between [%g,%g]" %
                         (s[cw,'datamin'], s[cw,'datamax']), 0 )

# Write the GPLOT input file

ob = Gplot()
ob.addcommand( "inset %s" % setname )
ob.addcommand( "box" )
ob.addcommand( "xsize 120" )
ob.addcommand( "ysize 120" )
ob.addcommand( "colour cyan" )
ob.addcommand( "levels %s" % levels )
ob.addcommand( "contour" )
ob.addcommand( "colour yellow" )
ob.addcommand( "font roman" )
ob.addcommand( "frame" )
ob.plotondevice( dev )

# Alternatives:
#ob.plotondevice( dev, gplotinput="mygplotinput.txt" )
#obplotondevice()                                      # X11 is default device
#ob.plotondevice( device='X11', gplotinput="mygplotinput.txt" )

gipsy.finis()
|
Modules
Using standard modules to list GIPSY sets
In GIPSY there is a task DISK that lists all the GIPSY sets in your working directory. Let's use Python to create a similar task, but now with the option to enter a directory from which all sets are listed including those in subdirectories. First you try to find a method that gets all the files in an directory and its subdirectories. This method is os.walk() so we need to import the os module. A GIPSY set must have a .descr extension so we need to find a method to match. This can be done with fnmatch() from the fnmatch module. Finally we need to know if the image part (ends on .image) exists. For this we use the glob() method. Further, os.stat() gives us file info like file size. The next program uses all these methods to create a handy utility. Notes:- We did not include a routine that checks whether a file is really a GIPSY descriptor.
- The os.walk() method does not follow symbolic links.
findsets.py
#!/usr/bin/env python
import os
import fnmatch
import gipsy
import glob


# Find all GIPSY sets in all sub directories starting at a given path
# Note: Symbolic links to directories are not treated as subdirectories


gipsy.init()
walkpath = gipsy.usertext( "PATH=",
                           "Enter path to start searching:   [current dir]",
                           default=1, defval='.', nmax=512 )
filetupel = os.walk( walkpath )
for dir in filetupel:
   for filenam in dir[2]:
      if fnmatch.fnmatch( filenam, "*.descr" ):
         base = filenam.replace( ".descr", "" )
         descrpart = dir[0]+'/'+ base + '.descr'
         impart = dir[0]+'/'+ base + '.image'
         sized = os.stat(descrpart)[6] / 1024.0
         if glob.glob( impart ):
            sizei = os.stat(impart)[6] / 1024.0
         else:
            sizei = 0.0
         gipsy.anyout( "%s decr=%d im=%d (kb)" %(dir[0]+'/'+ base ,sized, sizei) )


gipsy.finis()
|
Using PYFITS (nowadays: astropy.io.fits) to create a fits image viewer
Our Set class can perfectly deal with FITS files, but in this section we want to demonstrate how to manipulate a FITS file and to create a real (but temporary) GIPSY set from it. PYFITS is a Python module that enables a programmer to read, write and process FITS files. Next recipe is a small demonstration program that converts a FITS file to GIPSY format and displays the data with GIPSY task SLICEVIEW. Note that we are using import gipsy and from astropy.io import fits as pyfits to avoid problems with name spaces. The program asks for the name of a FITS file on disk. Then it wants to know what the name of the GIPSY set will be. A minimal set of header items is read from the FITS file and is used to construct the GIPSY set. The interface for the data is very simple. One can copy the image data with very few lines of code. The minimum and maximum of the image data are calculated and stored in the header of the new set. Then the GIPSY viewer SLICEVIEW is called to view the data for 2-dimensional data only.
fits2gds.py
#!/usr/bin/env python
import gipsy
import pyfits
import tempfile


gipsy.init()

fitsfile = gipsy.usertext("FITSFILE=", "Enter name of fits file: " )
fimg = pyfits.open( fitsfile )           # Open a fits file

# name = gipsy.usertext("SETNAME=", message="Set name: ")
name = tempfile.mktemp(dir='.')
gipsy.anyout( name )
s = gipsy.Set(name, create=True)         # Create a set with this name


# Next we want to read the minimum set of axes properties
# so that we can build a GIPSY set. We use the get() method
# to access a header item because a default value can be
# returned if an item doed not exist. For example DSS fits
# files does not have a ctype, so we substitute axis names
# 'X', 'Y', 'Z', 'A', 'B' etc.

prihdr = fimg[0].header                  # Assuming the data is in first hdu
naxis = prihdr['naxis']
for i in range(naxis):
   # Generate 'X', 'Y', 'Z', 'A', 'B' etc.
   defnam = chr(divmod(ord('X')-ord('A')+i,26)[1] + ord('A'))
   istr = str(i+1)                       # Start counting at 1, NAXIS1 etc.
   len = prihdr.get('naxis'+istr, 1)
   ori = prihdr.get('crpix'+istr, 1)
   nam = prihdr.get('ctype'+istr, defnam)
   gipsy.anyout( 'GIPSY: Creating axis %s %s %s' % (nam,ori,len ) )
   s.extend( nam, ori, len )
   s[0,'cunit'+istr] = prihdr.get('cunit'+istr, '??')
   s[0,'crval'+istr] = prihdr.get('crval'+istr, 1)
   s[0,'cdelt'+istr] = prihdr.get('cdelt'+istr, 1)

gdsimage = s.image

# Copy the contents
# Pitfall: Do not use the statement: gdsimage = fitsdata
# which would fail to copy the data because you lost your reference
# to s.image

gdsimage[:] = fimg[0].data

# Update the header with the minimum and maximum values of the data
s.wminmax()


if naxis == 2:
   gipsy.xeq( "SLICEVIEW INSET=%s ggiopt=fixcol" % name )

s.delete()

gipsy.finis()
|
This program shows how fast you can develop an application but we are not ready yet. For a robust task you need to check whether your FITS file exists and that your GIPSY set does not already exists. Further, we assumed that the image data was stored in the first hdu of the FITS file.
GUI Programming
Writing a GIPSY task in Python with a graphical user interface is relatively easy. Such a task usually consists of three components:- a collection of functions which will react to events caused by the user's interaction with the GUI elements;
- code which creates and positions the GUI elements;
- code which connects the events with the event-handling functions.
qt5slider.py
#!/usr/bin/env python

import sys
from math import *
from PyQt5.QtCore import *
from PyQt5.QtGui import *
from PyQt5.QtWidgets import *
import gipsy

slmin =   0                                   # slider's minimum value
slmax = 100                                   # slider's maximum value

fac = log(10.0)/float(slmax)

def sli2key(widget):                          # slider value -> keyword value
   return str(exp(float(QSlider.value(widget))*fac))

def key2sli(key):                             # keyword value -> slider value
   return log(gipsy.userdble(key))/fac

def show_value(cb):                           # display value in task status
   gipsy.status("Slider's derived value: %0.2f" % gipsy.userdble(cb.key) )

class Form(QDialog):
    def __init__(self, parent=None):
        super(Form, self).__init__(parent)
        self.slider = QSlider()
        self.slider.setOrientation(Qt.Horizontal)
        self.slider.setMinimum(slmin)
        self.slider.setMaximum(slmax)
        self.sliderlink = gipsy.QtLink("VALUE=", self.slider,
                                       keyval=key2sli, widgetval=sli2key)
                                              # connect keyword to widget
        layout = QVBoxLayout()
        layout.addWidget(self.slider)
        self.setLayout(layout)
        self.setWindowTitle("Log. slider")

gipsy.init()                                  # open connection with Hermes

app = QApplication(sys.argv)
gipsy.qtconnect()                             # connect Hermes events to Qt
gipsy.KeyCallback(show_value, 'VALUE=')       # register keyword callback
form = Form()
form.show()
app.exec_()

gipsy.finis()                                 # close connection with Hermes
|
You can change the slider value with keyword VALUE= on the
Hermes command line. This is a powerful feature because
other task can control this one bhy substituting this keyword.
Most GUI elements are associated with a user input keyword which will
be changed according to the user's actions on the element.
Consequently it is usually sufficient if the task handles the
keyword events caused by these keyword changes.
An exception is the handling of cursor information from a plot window.
More information about GIPSY's graphical user interface and event handling
can be found
here.
Interactive graph example
This annotated program draws a graph of the function y = A.sin(B.x). The user can modify the values of A and B with either an input field or a slider ('gauge'). Any change causes the graph to be re-drawn.
gui-graph.py
#!/bin/env python

from gipsy import *
import math

# ========================= Initial Parameters ===============================
NPTS = 100
a  = 0.7; b = 1.0
xmin =  0.0; xmax = 6.2831853;
ymin = -1.1; ymax = 1.1
incr = (xmax-xmin)/NPTS
xvals = list(map(lambda x: xmin+x*incr, range(NPTS)))  # list for Python 3
yvals = None;

# ========================== Functions =======================================

# ---------------------- keyword setter --------------------------------------
def triggerkey(key, value=None):
   wkey("%s%s" % (key, usertext(key, default=2, defval=str(value))))

# ---------------------- graph drawer ----------------------------------------
def drawplot():
   global yvals
   if yvals: pgline(xvals, yvals)                    # erase any previous graph
   yvals = list(map(lambda x: a*math.sin(b*x), xvals))     # compute new y-values
   pgline(xvals, yvals)                              # draw graph

# ---------------------- event handler for QUIT= keyword ---------------------
def quit(cb):
   if userlog(cb.key):
      wkey(cb.key)                                   # set back to False
      finis()                                        # terminate program

# ---------------------- event handler for both A= and B= keywords -----------
def number(cb):
   globals()[cb.var] = userreal(cb.key)              # assign to global variable
   drawplot()                                        # (re-) draw graph

# ====================== Main Program ========================================

init()                                               # program initialization

base = GgiBase()                                     # Ggi initialization

button = base.Button("QUIT=", "Terminate program")   # create button
text1  = base.TextField("A=", None, 10)              #   ,,   text input field
text2  = base.TextField("B=", None, 10)              #   ,,   text input field
gauge1 = base.Gauge("A=", None, 200, -1.0, 1.0)      #   ,,   slider
gauge2 = base.Gauge("B=", None, 200, 0.5, 5.0)       #   ,,   slider
plot   = base.PlotField("MYPLOT", 400, 300)          #   ,,   PGPLOT device
label  = base.Label("y = A*sin(B*x)")                #   ,,   text label

gauge1.setLabel(" ", 1)                              # remove standard ...
gauge2.setLabel(" ", 1)                              # ... label from sliders

button.setPosition(0, None, 0, None)                 # top left in window
plot.setPosition(0, None, 10, button)                # below button
label.setPosition(-(plot.width+label.width)/2, plot, # centered above plot
                  -plot.height-label.height-5, plot)
text1.setPosition(0, None, 10, plot)                 # below plot
text2.setPosition(0, None, 0, text1)                 # below text1
gauge1.setPosition(0, text1, 10, plot)               # right of text1
gauge2.setPosition(0, text2,  0, text1)              # right of text2

base.realize()                                       # activate Ggi
plot.open()                                          # open PGPLOT device
pgenv(xmin, xmax, ymin, ymax)                        # draw frame
plot.xor(True)                                       # XOR drawing mode
pgsci(3)                                             # green graph colour

KeyCallback(quit,   "QUIT=")                         # register QUIT= callback
KeyCallback(number, "A=", var='a')                   #    ,,    A=       ,,
KeyCallback(number, "B=", var='b')                   #    ,,    B=       ,,

triggerkey("A=", a)                                  # initialize keywords ...
triggerkey("B=", b)                                  # ... to draw first graph

mainloop()                                           # action!
|
Simple image viewer
The following example shows how a simple image viewer for GIPSY sets can be constructed. It consists of a plot window into which the image will be drawn, a composite element which enables the user to manipulate the colour map, and some menus and buttons for specifying the data set etc.
gui-image.py
#!/usr/bin/env python
from gipsy import *

NCI=200                                   # number of color indices

# ========================== Functions =======================================

# ---------------- event handler for FILE= keyword ---------------------------
def file_cb(cb):
   choice = userint(cb.key, defval=-1)
   if choice==0:
      GgiBase.base.Inset('SETNAME=', 'SET=', 'BOX=').ndims(2)
   elif choice==1:
      if GgiBase.base.verify('Really quit?', 'Yes, quit.', 'No, continue!'):
         finis()

# ---------------- event handler for SET= keyword ----------------------------
def inset_cb(cb):
   global set
   try:
      set.close()                         # close any previously opened set
   except:
      pass
   set = Set(usertext(cb.key))            # open set

# ---------------- event handler for BOX= keyword ----------------------------
def box_cb(cb):
   set.setbox(usertext(cb.key, defval=''))
   wkey('SHOW=YES')                       # cause SHOW= keyword event

# ---------------- event handler for SHOW= keyword ---------------------------
def show_cb(cb):
   if userlog(cb.key):
      image = set.subimage(set.subsets[0])        # (numpy-) image array
      if len(image.shape)!=2:                     # check dimensionality:
         reject('SET=', 'Must be 2-dimensional')  # wrong: reject input
         return
      idim = image.shape[1]                       # horizontal size
      jdim = image.shape[0]                       # vertical size
      tr = [-0.5/idim, 1.0/idim, 0.0, -0.5/jdim, 0.0, 1.0/jdim] # pgimag matrix
      imgmin = image.min(); imgmax = image.max()  # image min- and max-values
      pgsimi(userlog('INTERPOL='))                # image interpolation?
      pgimag(image, idim, jdim, 1, idim, 1, jdim, imgmin, imgmax, tr) # draw
      coled.limits(imgmin, imgmax)                # adjust color wedge's ...
      coled.units(str(set['BUNIT']))              # ... limits and units
      show.active(True)                           # enable 'SHOW' button
   wkey(cb.key)                                   # reset keyword (and button)

# ====================== Main Program ========================================

init()                                    # Open Hermes communication

base  = GgiBase()                         # Ggi initialization

file  = base.Menu('FILE=', 'Options menu', ['Inset', 'Quit'])          # menu
intp  = base.Button('INTERPOL=', 'Interpolation ON/OFF').setLabel('INTP') # btn
show  = base.Button('SHOW=', 'Show image').active(False)               # button
plotf = base.Form('PLOTFORM', 4)          # Frame for PGPLOT window
coled = base.ColorEditor(16, NCI)         # Color manipulation element
logo  = base.Logo()                       # The GIPSY logo

file.setPosition(0, None, 0, None)        # top left
intp.setPosition(0, file, 0, None)        # right to 'file'
plotf.setPosition(0, None, 10, file)      # below 'file'
coled.setPosition(0, None, 5, plotf)      # below 'plotf'
logo.setPosition(-logo.width, plotf, -logo.height, coled) # bottom right corner
show.setPosition(-show.width, plotf, 0, None)             # top right corner

plot = plotf.PlotField('PLOTTER', 400, 400)  # PGPLOT window
plot.setPosition(0, None, 0, None)        # top left in 'plotf'
plot.colors(16+NCI+1, False)              # allocate colors

base.realize()                            # initialize GUI
plot.open()                               # open PGPLOT device
pgscir(16, 16+NCI-1)                      # set color index range

KeyCallback(inset_cb, 'SET=')             # register keyword handler
KeyCallback(box_cb,   'BOX=')             #   ,,        ,,     ,,
KeyCallback(file_cb, 'FILE=')             #   ,,        ,,     ,,
KeyCallback(show_cb, 'SHOW=')             #   ,,        ,,     ,,

mainloop()                                # Action!
|
Advanced batch processing
Two more elaborate examples of batch processing are given below. Both run a simple task which does nothing more than 'thinking' about a given set during some random time. It is not a perfect task: it has a failure rate of about 10%. The code is given below.
think
#!/usr/bin/env python

from gipsy import *
import time, random

init()
inset = usertext('inset=')
delay = 2.0*random.random()+1.0
anyout('Start thinking about set "%s".' % inset)
time.sleep(delay)                                # simulate processing
if random.random()<0.1:                          # simulate 10% failure
   error(4, 'couldn\'t think about set "%s" anymore' % inset)
anyout('%s thought about set "%s" during %g seconds.'
        % (myname(), inset, delay))
finis()
|
The first example obtains an input set name and a list of subset numbers from the user. Then it runs the task think for all given subsets of the set. When think fails, an exception is raised which is caught by the script, which notes the subset number and eventually reports for which subsets the problem occurred.
batch1
#!/usr/bin/env python
from gipsy import *

init()

inset  = usertext("INSET=", "Input set name")
work   = userint("SUBSETS=", "Subset numbers", nmax=1000)

failed = []                           # list of subsets which failed

for subset in work:
   try:
      xeq('think inset=%s %d' % (inset, subset)) # start and wait for completion
   except:                                       # in case of failure ...
      failed.append(subset)                      # ... register subset number

if failed:
   anyout("Subset(s) failed: %s" % repr(failed))

finis()
|
Now suppose that you have a multi-core or multiple CPU machine and that the
operations on subsets are independent of each other. Then
you may want to run multiple parallel instances of think.
GIPSY's event mechanism makes this possible. The following example
shows how.
Again
an input set name and a list of subset numbers are obtained from the user.
Also how many parallel tasks should be run. The first tasks are started in a
loop by calling the function runjob().
For every task started, runjob() schedules a keyword event which
will be handled by the callback function jobdone()
which will note possible failures and call runjob()
to start the next instance of think if there is still work to be done.
When the first tasks have been started, the script calls mainloop().
Mainloop() then will call jobdone() whenever a task has
exited. It will return when all subsets have been processed.
batch2
#!/usr/bin/env python
from gipsy import *

def runjob():
   if work:
      subset  = work.pop(0)             # get next subset to be processed
      job     = inactive.pop(0)         # obtain free job identifier ...
      active.append(job)                # ... and put it in the active list
      jobname = 'job%d' % job           # job name (and job keyword)
      KeyCallback(jobdone, jobname, subset=subset, job=job)
                                        # schedule task completion callback
      xeq('%s(think) inset=%s %d' % (jobname, inset, subset), jobname)
                                        # start task and continue

def jobdone(cb):
    active.remove(cb.job)               # move job identifier from active ...
    inactive.append(cb.job)             # ... to inactive list
    fate = userint(cb.key)              # read task's exit status ...
    if fate<0:                          # ... and in case of failure ...
       failed.append(cb.subset)         # ... register subset number
    runjob()                            # start next job
    cb.deschedule()                     # deschedule this job's callback

init()

inset  = usertext("INSET=", "Input set name")
work   = userint("SUBSETS=", "Subset numbers", nmax=1000)
npar   = userint("NPAR=", "Number of parallel jobs")

failed   = []                           # list of subsets which failed
active   = []                           # job identifiers in use
inactive = range(npar)                  # available job identifiers

while inactive:                         # start the first 'npar' jobs
   runjob()

mainloop()                              # event loop: returns when there ...
                                        # ... are no scheduled callbacks left
if failed:
   anyout("Subset(s) failed: %s" % repr(failed))

finis()
|
