A tale of two clusters
The surveyed clusters, Abell 2192 and 963 (A2192 and A963 hereafter), are known to be very different in their dynamical state and star formation properties. A963, at z = 0.206, has a velocity dispersion of 1350 km s-1 and is one of the nearest B-O clusters with a high fraction (19%) of blue galaxies (Butcher et al. 1983). This lensing X-ray cluster is unusually relaxed with less than 5% substructure (Smith et al. 2005). A2192, at z = 0.188, has a velocity dispersion of 650 km s-1 and is much more diffuse. So far, it has not been detected in X-rays and the fraction of blue galaxies in this cluster has not yet been determined. Our optical spectroscopy campaign has shown that the less massive cluster A2192 has a significant degree of substructure (Jaffe et al. 2012). As shown in the redshift pie diagram in the home page, the clusters only occupy a tiny fraction of the volume probed by the WSRT.
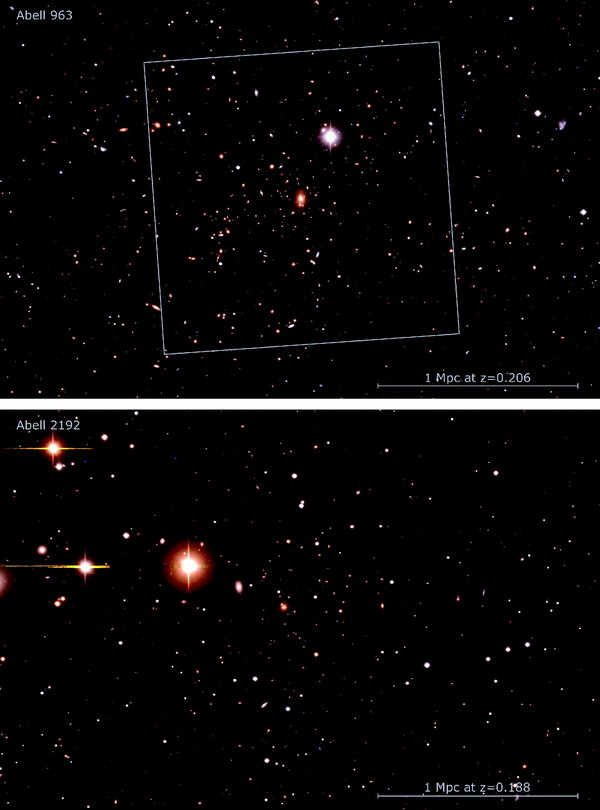
The figure below shows optical images, 1.5 Mpc x 2 Mpc on a side, of the central regions of A963 (top) and A2192 (bottom). Colours are constructed from B- and R-band images taken with the Wide Field Camera on the Isaac Newton Telescope at La Palma for A963, and with the NOAO Mosaic Camera on the 0.9m at Kitt Peak for A2192. The colour scales are slightly different for the two images. The area of A963 within which Butcher et al. (1983) determined the fraction of blue galaxies is indicated with a box.
Our spectroscopic campaign has been essential in characterizing the environments of these clusters. With hundreds of new redshifts we have mapped the surveyed volumes finding several structures, as shown schematically in the figure below.
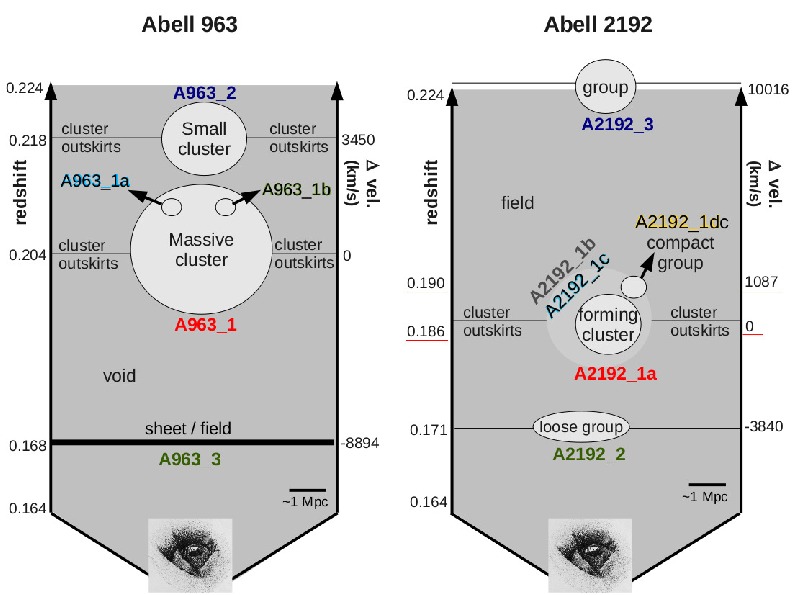
The eyes looking upwards at the bottom of each panel indicate the line-of-sight. As a consequence redshift increases vertically (left axis). Only the redshift range of the HI observations is shown. Additionally, the axes on the right of each panel indicate the velocity difference (Delta_vel.) between each structure and the main cluster (A963_1 in the left panel and A2192_1a in the right panel). The sizes of the clusters have been roughly scaled for comparison, in accordance with the 1 Mpc scale (at the main cluster's redshift) shown at the bottom-right (black solid line) of each panel.