I. The WSRT observations
The HI observations were carried out at the Westerbork Synthesis Radio Telescope (WSRT), and reach an effective volume depth of 328 Mpc, with a coverage on the sky of ~12 x 12 Mpc for each cluster, which allow us to study the large-scale structure around the two Abell clusters. This campaign was possible thanks to a new back end and the low system temperature of the WSRT. After integrating for 117x12h on A963 and 76x12h in A2192, we detected HI in over 150 galaxies at 0.16 < z < 0.22.
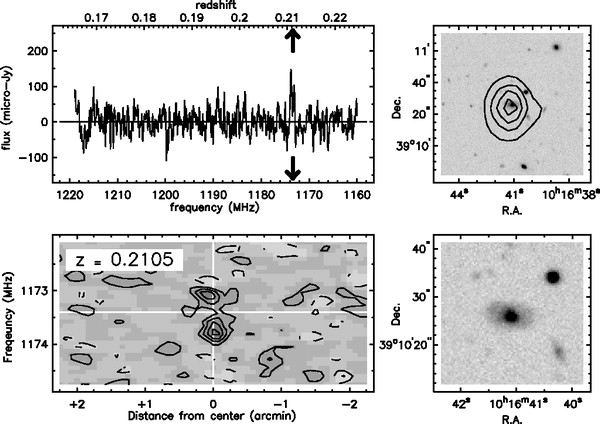
The figure below shows one example of our HI detections: a spatially resolved galaxy at the same redshift as A963. Top left: HI spectrum over the full velocity range. Arrows indicate the redshift (top) and observed frequency (bottom) of the HI emission. Bottom left: Position-velocity diagram extracted from the HI data cube, taken along the major axis of the galaxy. The horizontal white line indicates the systemic velocity. The vertical white line coincides with the spatial centre of the galaxy. Top right: Integrated HI map in contours overlaid on an R-band image in gray scale. Bottom right: Enlargement of the optical image, showing the morphology of a normal spiral galaxy.
With the HI data alone, we could already construct maps of the large-scale structure in the volumes by using the position and redshift of the detections. This is shown in the rotating rendered HI data cubes below. Note that the depth of the volumes is compressed. The dimensions of cubes are: 9.5 x 9.5 x 325 Mpc^3. The synthesized beam size is: 65 x 80 kpc^2 x 80 km/s.
| Abell 2192 | Abell 963 |
 |
 |
II. Optical Imaging
A2192 and A963 have SDSS photometry. In addition, we obtained B- and R-band imaging with the Isaac Newton Telescope (INT) in both clusters. These observations over a 1 square degree field were carried out under significantly better seeing conditions, and are much deeper than the available SDSS photometry.
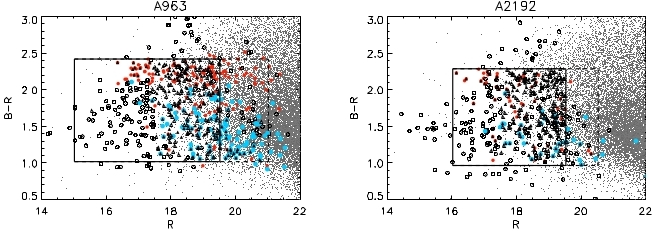
The colour-magnitude diagrams (CMDs) below show the galaxies in A963 (left) and A2192 (right). All galaxies in the SDSS photometric catalogues and in our INT images are plotted in small gray dots. The red filled circles indicate galaxies with literature redshifts that lie inside the HI redshift range (0.16 < z < 0.22), whilst the black open circles are those with literature redshifts outside this range. The bigger blue filled circles highlight the HI-detected galaxies. In both clusters, a clear red sequence lies above a populated blue cloud. Solid triangles correspond to new WHT redshifts inside the HI redshift range, and open triangles are those with WHT redshifts outside the range. In each case, the solid box delimits the region containing the galaxies targeted for spectroscopy, and the extended dashed area shows the fainter range in which only galaxies with HI detections were targeted.
The optical images were also useful for determining the visual morphologies of the galaxies. Due to the quality of the images, we limited ourselves to distinguish between early-type galaxies (E/S0) and late-types (S and Irr). Some examples are illustrated below.
In the above figure, the panel a) shows a spiral galaxy, b) another spiral, c) an elliptical, d) an S0, and e) and f) undetermined morphology.
III. Optical Spectroscopy
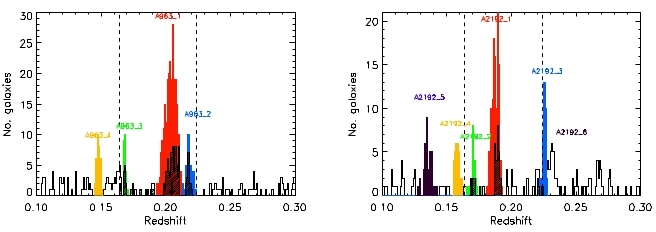
The spectroscopic observations were made using the AutoFib2+WYFFOS (AF2) wide-field, multi-fiber spectrograph mounted on the 4.2m WHT in La Palma. We used the R600B grism with the 2-chip EEV 4300x4300 mosaic that counts with 13.5micron pixels. Using a 2x3 binning of the CCD pixels, we obtained a spectral resolution of ~4A FWHM (depending on the location on the CCD). The spectra were centered on a wavelength of ~4900A and covered the range ~3900-6900A. In this range, galaxies at the targeted redshift showed spectral features from the Ca H&K lines, and the line in the blue, up to NaD in the red (see Figure 4). We targeted galaxies brighter than R=19.5 as well as fainter HI-detections (up to R~21, as shown by the boxes in the CMDs above) and obtained hundreds of new redshifts (shown in the histograms below) and equivalent widths of the [OII] emission.
The optical spectroscopy and its main products, naimely the redshifts, cluster velocity dispersions, R_200, and EW [OII], are presented in Paper I. Data tables associated to this paper can be found in the catalogues page, and complementary videos are arso availabe here.
IV. NUV and FUV
Under construction
V. Spitzer and Herschel data
Under construction