Animated BUDHIES
1) The HI cubes:
The figures below show rotating rendered HI data cubes. Note that the depth of the volumes is compressed. The dimensions of cubes are: 9.5 x 9.5 x 325 Mpc^3. The synthesized beam size is: 65 x 80 kpc^2 x 80 km/s.| Abell 2192 | Abell 963 |
 |
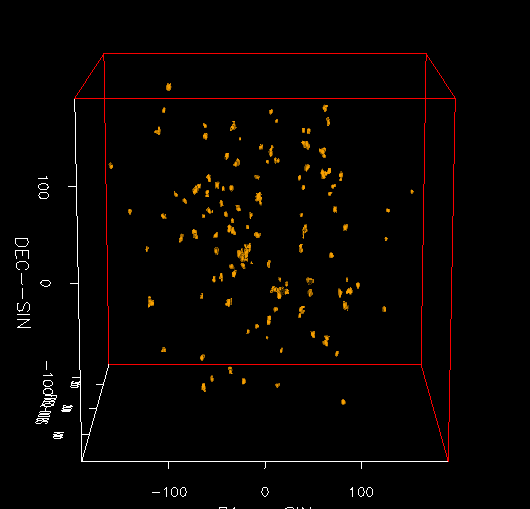 |
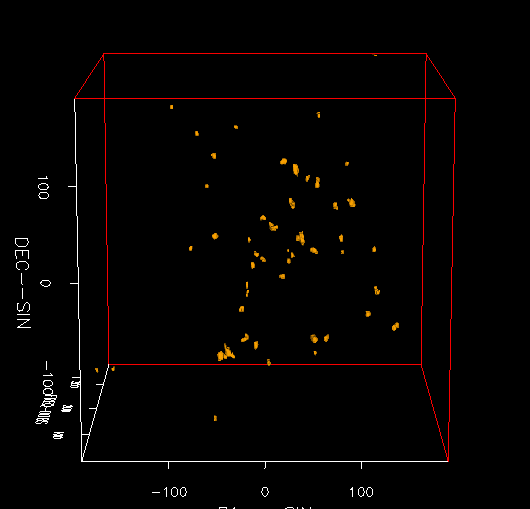
2) The Optical spectroscopy cubes:
3D views of the clusters and their surroundings were also made from the optical spectroscopy catalogues as shown below.
| Abell 2192 | Abell 963 |
The 3D visualizations show the distribution of galaxies in the main clusters. The galaxies are plotted in right ascension vs. declination vs. redshift.
The left-hand side shows A2192_1 split into its sub-tructures: A2192_1a (red), A2192_1b (gray), A2192_1c (turquoise), and A2192_1d (yellow). It is clear from this view of the cluster that there is a high degree of substructure clearly separated in space, as well as velocity. In Jaffe et al (2012) we concluded that this cluster is in the process of forming, and that the central structure (A2192_1a) is in the process of accreting the surrounding sub-structures.
The right-hand side panel shows the massive cluster A963_1 (red) and its sub-structures A963_1a (turquoise) and A963_1b (green), as well as A963_1's smaller nearby companion, A963_2 (blue). Smaller symbos represent the galaxies with less reliable redshifts. Although A963_1 and A963_2 are barely separated in velocity, they are distict clusters and A963_2 is located outside the turnaround radius of A963_1.