 Plotfields, Images and Color Maps
Plotfields, Images and Color Maps
Plotfields, Images and Color Maps
Within Ggi, there is one master color map which is shared by
all plotfields. When Ggi is initialized, this color map is 16 elements long
and contains PGPLOT's base colors. These 16 elements
cannot be modified.
Calling PGSCR for these elements is
illegal. The number of colors in the master color map can
be increased by calling
GgiPlotColors().
This is done only once in the initialization phase of the program.
The colors from the master color map can be assigned to the color maps
of individual plot fields. This is done with
GgiPlotMapColors().
Using this routine, many kinds of mappings can be specified.
For instance
it is possible to assign different parts of the master color map to different
plot fields, so that each has its private set of colors. But it is also
possible that plot fields share their colors, all or some of them,
so that the change
of a color representation for one plot has also effect on other plots sharing
the same color index.
/* example7.c -XT */
#include "stddef.h"
#include "math.h"
#include "gipsyc.h"
#include "cmain.h"
#include "init.h"
#include "finis.h"
#include "userfio.h"
#include "pgplot.h"
#include "ggi.h"
#define ROWS 100 /* number of image rows */
#define COLS 100 /* number of image columns */
#define NCI 50 /* number of color indices */
/*
* QUIT= keyword handler
*/
static void quit(ident id, char *key, int code, void *arg)
{
bool button=toflog(FALSE);
(void)userflog(&button, 1, 2, key, " ");
if (tobool(button)) {
wkeyf(key);
finis_c();
}
}
/*
* Main program
*/
MAIN_PROGRAM_ENTRY
{
ident plotter, bquit;
float image[ROWS][COLS];
int i, j;
float tr[6];
float a1=0.0, a2=1.0;
fint idim=COLS, jdim=ROWS, i1=1, i2=COLS, j1=1, j2=ROWS;
fint cilo=16, cihi=16+NCI-1;
init_c();
GgiAutoLayout(FALSE); /* custom layout */
GgiPostponeRealize(TRUE); /* don't show immediately */
(void)GgiPlotColors(NULL, 16+NCI); /* NCI additional colors */
plotter = GgiPlotField("PLOT", 325, 325); /* create plot field */
GgiPlotMapColors(plotter, 0, 16, 16, NCI, -1); /* assign colors to plotter */
bquit = GgiButton("QUIT=", NULL);
GgiSetPosition(plotter, 0, NULL, 0, NULL); /* top left */
GgiSetPosition(bquit, 0, NULL, 0, plotter); /* below plotter, left */
(void)ScheduleKeyevent(quit, "QUIT=", KEYCHANGE, NULL); /* handle QUIT */
GgiRealize(); /* show what we've made */
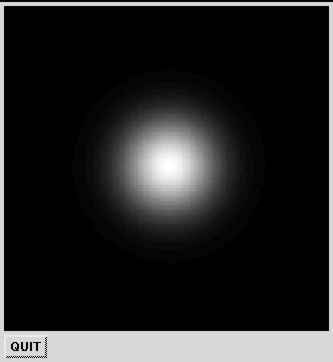
for (j=0; j<ROWS; j++) { /* build "image" */
for (i=0; i<COLS; i++) {
float x = i-COLS/2, y = j-ROWS/2, w = 3*COLS;
image[j][i] = exp(-(x*x+y*y)/w);
}
}
(void)pgopen_c(tofchar("PLOT")); /* open plotter */
for (i=0; i<NCI; i++) { /* grayscale color map */
float value=(float)i/(float)(NCI-1);
fint ci=i+16;
pgscr_c(&ci, &value, &value, &value);
}
pgscir_c(&cilo, &cihi); /* set color index range */
/* tranformation matrix */
tr[0] = 0.0; tr[1] = 1.0/(float)COLS; tr[2] = 0.0;
tr[3] = 0.0; tr[4] = 0.0; tr[5] = 1.0/(float)ROWS;
/* display image */
pgimag_c(&image[0][0], &idim, &jdim, &i1, &i2, &j1, &j2, &a1, &a2, tr);
MainLoop();
}


|
Maintained by J. P. Terlouw |