
GPLOT recipes: Plotting profiles in GPLOT (I)
! Example of profile extracted from the 3-dim set 'n3198h'
! The set has axes RA,Dec,Freq
!
! =============== First plot =================
colour foreground ! Set colour to foreground colour
font roman ! Roman font
symbol 21 ! Small circle to mark profile points
location 30 180 ! Start position upper plot
charheight 4.0 ! Set character height to 4 mm
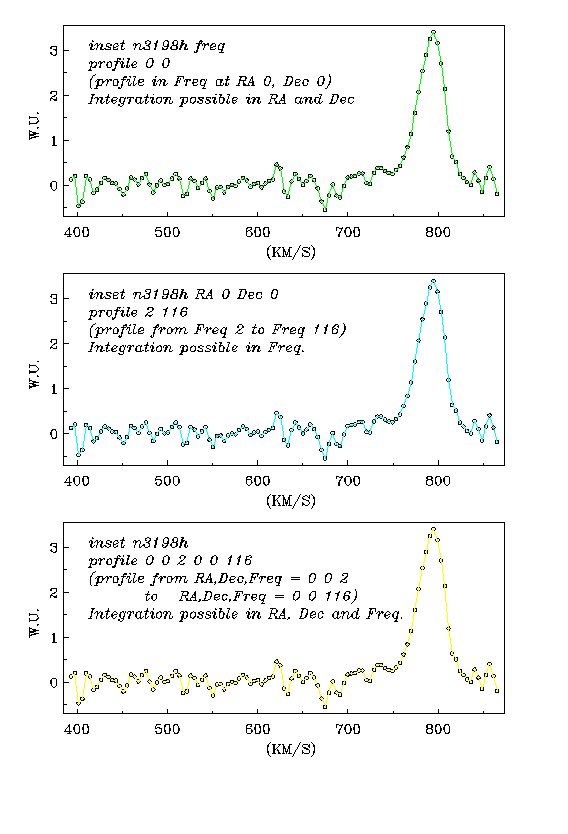
inset n3198h freq ! Select Freq. axis as profile axis
profile 0 0 ! Select profile in freq at RA 0, Dec 0
profdata ! Store extracted data in xcolumn, ycolumn
xrange xcolumn ! Range of x values set to min/max of coordinate data
yrange ycolumn ! Range of y values set to min/max of image data
xmargin 2 ! Space in mm between data and axes
ymargin 2
xsize 120 ! Horizontal size in mm
ysize 50
profaxis bp ! Draw the profile axis at the bottom
axtitle ! Default title
axis lw ! Left axis shows labels with image values
axtitle W.U. ! Title for this axis
axis t
axis r
points ! Mark profile points
colour green
connect ! Connect the points
!
!=============== Second plot =================
!
colour foreground
location 30 110
inset n3198h RA 0 Dec 0
profile 2 116 ! Select profile from freq 2 to 116
profdata
xrange xcolumn
yrange ycolumn
xmargin 2
ymargin 2
xsize 120
ysize 50
profaxis bp ! draw the profile axis at the bottom
axtitle
axis lw
axtitle W.U.
axis t
axis r
points
colour cyan
connect
!
!================ Third plot =================
!
colour foreground
location 30 40
inset n3198h
profile 0 0 2 0 0 116 ! Select profile from freq 2 to 116 at
! RA=0, Dec=0
profdata
xrange xcolumn
yrange ycolumn
xmargin 2
ymargin 2
xsize 120
ysize 50
profaxis bp ! draw the profile axis at the bottom
axtitle
axis lw
axtitle W.U.
axis t
axis r
points
colour yellow
connect
!=============== Annotations ==================
mmeter ! Switch to mm mode
charheight 4
font italic ! Italic font
colour foreground
move 35 225
text inset n3198h freq
move 35 225-5
text profile 0 0
move 35 225-10
text (profile in Freq at RA 0, Dec 0)
move 35 225-15
text Integration possible in RA and Dec
move 35 155
text inset n3198h RA 0 Dec 0
move 35 155-5
text profile 2 116
move 35 155-10
text (profile from Freq 2 to Freq 116)
move 35 155-15
text Integration possible in Freq.
move 35 85
text inset n3198h
move 35 85-5
text profile 0 0 2 0 0 116
move 35 85-10
text (profile from RA,Dec,Freq = 0 0 2
move 35 85-15
text @@@@@@@@@to RA,Dec,Freq = 0 0 116) ! '@' == Leading space
move 35 85-20
text Integration possible in RA, Dec and Freq.
world
