
GPLOT recipes: A profile mosaic (command file generated with C-program)
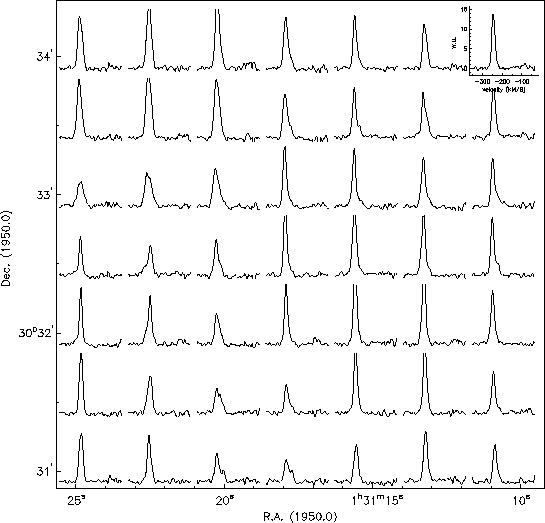
The plot shows a number of (velocity) profiles centered at calculated
locations. The GPLOT command file that created this plot, is generated
by a small C-program.
The GPLOT macro:
First we list the command file that produced the plot. All unnecessary
repetitions are left out. In fact, this recipe demonstrates how we can
create command files with a lot of repetitions (note that GPLOT itself has no
loop control). Most people will use COLA to write these kind of files,
but if you have some experience in C-programming, why not write a C-program?
The C-program that was used to generate the command file, is discussed
after the GPLOT macro.
device                         ! Ask output destination
charheight 4                   ! Character height is 4 mm
inset M33.S30.eqsig -29:49     ! Define a number of subsets (FREQ -29 to 49)
profile -15 -15                ! Extract a profile at RA,DEC = -15 -15
profdata                       ! Copy data to xcolumn and ycolumn
xrange xcolumn                 ! Plot limits in x is min/max of xcolumn
yrange -1 5
xmargin 1
ymargin 1
location 25 25
xsize 8
ysize 8
connect                        ! Plot lines between extracted profile points

profile -12 -15                ! Repeat for different position
profdata
xrange xcolumn
yrange -1 5
xmargin 1
ymargin 1
location 35 25
xsize 8
ysize 8
connect

profile -9 -15
profdata
xrange xcolumn
yrange -1 5
xmargin 1
ymargin 1
location 45 25
xsize 8
ysize 8
connect
   .
   .
   etc.
   .
   .
charheight 2
profaxis bp                    ! Label the upper right profile axis
axtitle
profaxis lw
axtitle W.U.

inset M33.S30.eqsig 0          ! Plot frame that encloses mosaic
location 25 25
box -15 -15 15 15
xsize 100
ysize 100
charheight 4
axis bp
axtitle
axis lp
axtitle
axis r
axis t
Now we discuss the C-program that generated the command file. The
output is written to a file tmp.mac. The program calculates,
given the number of profiles and the size of the plot, the
start positions (in mm) of the profiles (location x, y).
The data is a RA-DEC-FREQ cube and the set is entered as
inset M33.S30.eqsig -29:49. So a number of subsets in
frequency direction is specified and the profile direction is fixed.
A profile can be extracted if the position in R.A., Dec is
appended to the profile command. For each profile in the
mosaic, the program calculates this R.A., Dec position in grids.
/*--------------------------------------------*/
/* promos.c made by Olaf Kolkman, jul 6, 1995 */
/*--------------------------------------------*/
#include "stdio.h"
#include "stdlib.h"
#include "string.h"

#define xno      7.0     /* No of profiles in x,y direction */
#define yno      7.0

#define size     100.0   /* size of the total image in mm (always square)*/
#define margin   1.0     /* margin around the profiles */

#define X0       25.0    /* distance from the lower left corner of the */
#define Y0       25.0    /* paper in mm */

#define dX       3.0     /* Pixel separations between profiles */
#define dY       3.0     /* this can be e.g. the number of pix per beam */

#define setname  "M33.S30.eqsig"      /* name of the set */
#define setsub   "-29:49"             /* subset range e.g. "-29:49"  or "f" */
#define yrange   "-1 5"               /* yrange (interval of image values) */


int main(int argc, char * argv[])
{
  int     i,j;
  double  box_dx,box_dy;
  FILE    *outfile;

  if (argc!=3)
  {
    printf("Usage: promos X Y\n");
    printf("       where X Y are the pixel coordinates of the center profile \n");
    return(1);
  }

  if(!(outfile=fopen("tmp.mac","w")))
  {
    printf("Unable to open file ... exiting");
    exit(1);
  }

  box_dx=size/xno;    /* size of an individual profile plot box */
  box_dy=size/yno;

  fprintf(outfile,"device\n");
  fprintf(outfile,"charheight 4\n");
  fprintf(outfile,"inset %s %s\n",setname,setsub);

  /*plot the profiles from left to right bottom to top */
  for(j=0;j<yno;j++)
  {
    for(i=0;i<xno;i++)
    {
      /* The middle of the individual profile box comes at the */
      /* position where the profile is taken */

      fprintf(outfile,"profile %g %g\n",
	      atoi(argv[1])-(xno/2-i)*dX,
	      atoi(argv[2])-(yno/2-j)*dY);
      fprintf(outfile,"profdata");
      /* yrange is fixed */
      fprintf(outfile,"xrange xcolumn\nyrange %s\n",yrange);
      fprintf(outfile,"xmargin %g\nymargin %g\n",margin,margin);
      /* location of profile plot */
      fprintf(outfile,"location %g %g\n",X0+i*box_dx,Y0+j*box_dy);
      fprintf(outfile,"xsize %g\nysize %g\n",box_dx-2*margin,box_dy-2*margin);
      fprintf(outfile,"connect\n\n\n");
    }
  }
  /* For the last plot.... plot the axes */
  fprintf(outfile,"charheight 2\n");
  fprintf(outfile,"profaxis bp\naxtitle\nprofaxis lw\naxtitle W.U.\n");


  /* finaly enclose the profile plots with an coordinate grid. */

  fprintf(outfile,"inset %s 0\n",setname); /* assuming subset 0 exists */
  fprintf(outfile,"location %g %g\n",X0,Y0);
  fprintf(outfile,"box %g %g %g %g\n",
	  atof(argv[1])-((xno)/2)*dX,
	  atof(argv[2])-((yno)/2)*dY,
	  atof(argv[1])+((xno)/2)*dX,
	  atof(argv[2])+((yno)/2)*dY);
  fprintf(outfile,"xsize %g\nysize %g\n",size,size);
  fprintf(outfile,"charheight 4\n");
  fprintf(outfile,"axis bp\naxtitle\naxis lp\naxtitle\naxis r\naxis t\n");

  fclose(outfile);

  printf("Done ... Written file tmp.mac\n");
  return(EXIT_SUCCESS);
}
