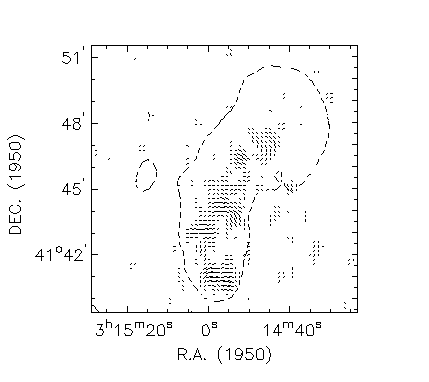


For a plot with polarisation vectors, you need a set with intensities (inset) that represent the vector lengths, and a set with numbers in degrees or radians (polset) that represent the vector angles (angles with respect to the north). The default angle mode is radians, but this can be changed with command polmode.
inset polintclipped0.25 0       ! Set with intensities --> vector lengths
box 20 102 d 62 62              ! Box centered at 20 102, sizes 62x62
xsize 75                        ! Plot sizes 75x75 mm
ysize 75
charheight 4.8
axdelta 20 HMSSEC               ! Step for major ticks alonng X axis
axpos * 3 15 20                 ! Write first label at 3h15m20s
axformat hmS                    ! Always write seconds
axis bp
axtitle R.A. (1950)
axpos * 41 42 0
axdelta 3 arcmin
axis lp
axtitle DEC. (1950)
axis tpa00                      ! Top axis has no labels
axis rpa00
polmode R                       ! Angles are in radians
polset polang 0                 ! Read the (sub)set with the vector angles
The polarisation vectors will be plotted with command polplot. This command controls two options. The first two numbers are integers that set a grid mask. For instance polplot 2 3 will plot vectors on each second grid in the x direction and on each third grid in the y direction. The default is 1 1, i.e. on all grid positions a vector will be plotted. A third number in the polplot command sets the conversion of an intensity to a vector length in grids. If you want to fit the longest vector in just one grid, find Imax, the maximum intensity in the data specified with inset, and set the scale to 1/Imax. If you omit this number, a default will be calculated, so that the longest vector fits in one grid.
polplot 2 2 1/0.9               ! Plot the contours
inset 49cm 0                    ! Total intensity map for the contour
lstyle 2                        ! Select dashed line style
levels 7.5                      ! Select one level
conto                           ! Plot the contour
