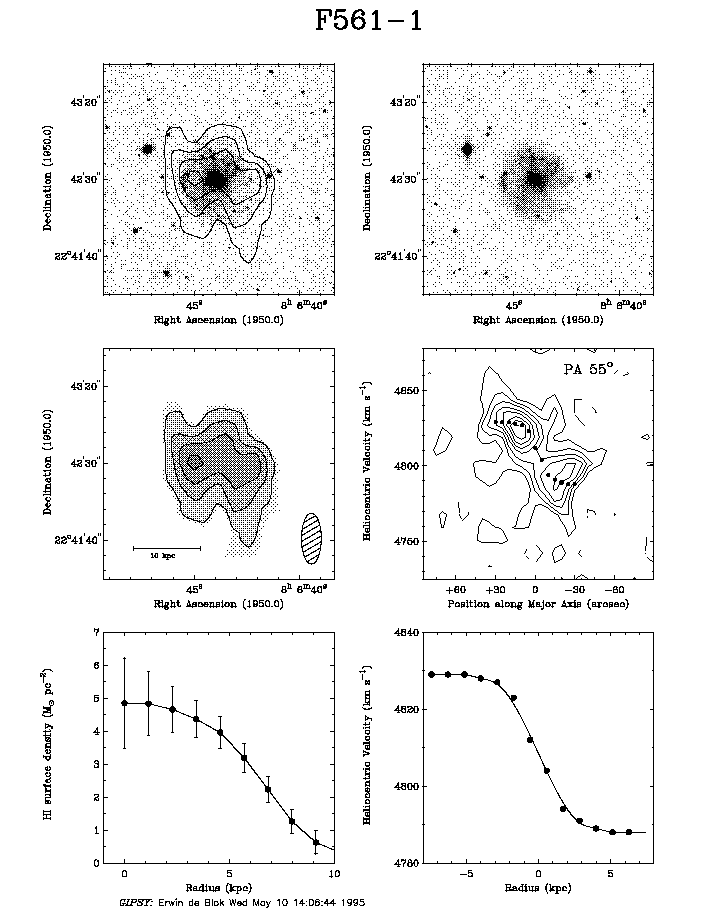

GPLOT recipes: A black and white panel

charheight 2.8               ! Set the character height in mm
lwidth 3                     ! Set the line width
font roman                   ! Slect font Roman
mmeter                       ! Go to millimeter mode
move 33 8
id                           ! Plot user name and date.
world                        ! Back to world coordinates
!
!  WINDOW 1 1 : HI profile
!
location 30 20
xcol f5611hiprof.dat 2       ! Fill xcolumn with data from file
ycol f5611hiprof.dat 5
xcol 47*xcolumn/206          ! Process data, do not abbreviate variable name
ycol 1.177*ycolumn/1.33
xrange -1 10                 ! Set limits in x (note: there is no input set)
yrange 0 7                   ! Set limits in y
xsize 65                     ! Set size in mm in x
ysize 65
connect                      ! Connect points in x/ycolumn
symbol 17                    ! Marker is a filled dot
charheight 6
points                       ! Mark the points with symbol 17
charheight 2.8
axis bp
axis lp
axis tpa00                   ! Plot ticks but no labels
axis rpa00
eycol f5611hiprof.dat 7      ! Fill the error column for y data
eycol (1.177/1.33)*0.3*2.4/sqrt((eycolumn*1.25*1.25)/(pi*6.5*16.5))
errorbar y -y                ! Plot error bars in y
xlabel Radius (kpc)          ! Label at bottom of plot
angle 90
mmeter
move 15 53
justific 0.5                 ! Centre text
text HI surface density (M\d\(2281)\u pc\u-2\d)
angle 0
world
!
! WINDOW 2 1 : Rotation curve
!
location 120 20
xcol f5611tot 1
ycol f5611tot 2
xcol -47*(xcolumn+2.5)/206
xrange -8 8
yrange 4780 4840
xsize 65
ysize 65
symbol 17
charheight 6
points
charheight 2.8
xcol f5611.symcur 1
ycol f5611.symcur 2
xcol -47*(xcolumn-0)/206
ycolumn ycolumn+4808.5
connect
xcol f5611.symcur 1
ycol f5611.symcur 2
xcol 47*(xcolumn+0)/206
ycolumn -ycolumn+4808.5
connect
axis bp
axis lp
axis tpa00
axis rpa00
xlabel Radius (kpc)
angle 90
mmeter
move 105 53
justific 0.5
text Heliocentric Velocity (km s\u-1\d)     ! Use superscript in text
angle 0
world
!
! WINDOW 1 2 : HI Map
!
location 30 100
inset /zwi2/users/blok/Synthesis/Moments/wsrt/f5611.hi.rep.klein p
box -156 -56 -35 64
xsize 65
ysize 65
move 0 0
mmeter
move 15 133
justific 0.5
angle 90
text Declination (1950.0)
angle 0
world
move 0 0
location 30 100
level 0.5 0.9:13.5:1.8               ! Plot Gray Scales FIRST
Note that the order of plotting grayscales and contours is important. In a PostScript file the contours are plotted with PostScript commands, but a grayscale is a PostScript image. Everything plotted in a box before the grayscale will be erased. So plot the grayscale first and add contours later.
grayscale
level 0.9:18:1.8
contours                             ! plot contours over gray scale plot
axis bp
xlabel Right Ascension (1950.0)
axis lp
axis tpa00
axis rpa00
move -47 -35
beam 13 arcsec 33 arcsec             ! Plot shaded ellipse. Axes are FWHM
move -140 -40                        ! Draw a 'distance' bar
draw -105 -40
move -140 -39
draw -140 -41
move -105 -39
draw -105 -41
move -125 -45
charheight 2
text 10 kpc
charheight 2.8
!
! WINDOW 2 2 : xv cut
!
location 120 100
inset /zwi2/users/blok/Synthesis/Cubes/wsrt/f5611.velsmo.sum p
box -17 22 18 40
xsize 65
ysize 65
move 0 0
mmeter
move 105 133
justific 0.5
angle 90
text Heliocentric Velocity (km s\u-1\d)
angle 0
world
move 0 0
location 120 100
lwidth 2
lstyle 2
level -1
contours
lstyle 1
level 1:20:0.5
contours
lwidth 3
axis lp
axis rpa00
axdelta 30 arcsec
axminors 2
axis bpo
xlabel Position along Major Axis (arcsec)
axdelta 30 arcsec
axminors 2                        ! 2 minor ticks between major ticks
axis tpa00
move  8 38
charheight 4
text PA 55\uo\d
charheight 3.6
!
! Now overlay the rotation curve
!
location 120 100
xcolumn f5611tot 1
ycolumn f5611tot 2
xcolumn -xcolumn
xrange -17*5 18*5
yrange 4724.97 4878.17
xsize 65
ysize 65
symbol 17
points
charheight 2.8
!
! WINDOW 1 3 : R + HI
!
location 30 180
inset /zwi2/users/blok/Synthesis/Moments/wsrt/f5611.hi.rep.klein p
box -156 -56 -35 64
xsize 65
ysize 65
inset /zwi2/users/blok/ubvri/Pictures/rotf5611r_f
overbox
overlay on
level 7080:7980:56.25
grayscale
overlay off
inset /zwi2/users/blok/Synthesis/Moments/wsrt/f5611.hi.rep.klein p
box -156 -56 -35 64
xsize 65
ysize 65
level 0.9:18:1.8
contours
axis bp
axis lp
axis tpa00
axis rpa00
xlabel Right Ascension (1950.0)
angle 90
mmeter
move 15 213
justific 0.5
text Declination (1950.0)
angle 0
world
!
! WINDOW 2 3 : B optical
!
location 120 180
inset /zwi2/users/blok/Synthesis/Moments/wsrt/f5611.hi.rep.klein p
box -156 -56 -35 64
xsize 65
ysize 65
inset /zwi2/users/blok/ubvri/Pictures/rotf5611b
overbox
overlay on
level 1005:1305:19
grayscale
overlay off
inset /zwi2/users/blok/Synthesis/Moments/wsrt/f5611.hi.rep.klein p
box -156 -56 -35 64
xsize 65
ysize 65
axis bp
axis lp
axis tpa00
axis rpa00
xlabel Right Ascension (1950.0)
angle 90
mmeter
move 105 213
justific 0.5
text Declination (1950.0)
angle 0
world
mmeter
move 105 255
lwidth 5
charheight 8
text F561-1
lwidth 3
