Void Hierarchy:
Evolution Experiments
Evolution Experiments
project in collaboration with Erwin Platen, Pablo Araya \& Ravi Sheth
Reference:
![]() Void
Hierarchy: excursion set formulation (project with R. Sheth)
Void
Hierarchy: excursion set formulation (project with R. Sheth)
The hierarchical development of the void network in a SCDM GIF simulation.
At a redshift z=3 void regions are identified by means of the watershed algorithm.
The interstices regions are tagged, and subsequently their Lagrangian path followed
up to a redshift z=0. The hierarchical evolution of voids becomes surprisingly clear.
In the interior of voids subvoids diffuse and merge into larger voids,
while vigorous demolition of small voids is observed near the boundaries of voids.
Note how strong shearing flows and forces are responsible for the deformation of
voids before their final demise.
Animated gif (click): idea and processing by Erwin Platen
GIF simulation: J. Colberg and the Virgo consortium.
Movie 1:
Superimposed evolving void in 2 cosmological power law power spectrum scenarios
green: delta(R_G)=-2.5; blue: delta(R_G)=-1.5;
voidscale: R_G = 7h^{-1} Mpc, boxlength: 100h^{-1} Mpc
Notice the striking hierarchical evolution of void structure
Animated gif (click)
Movie 2:
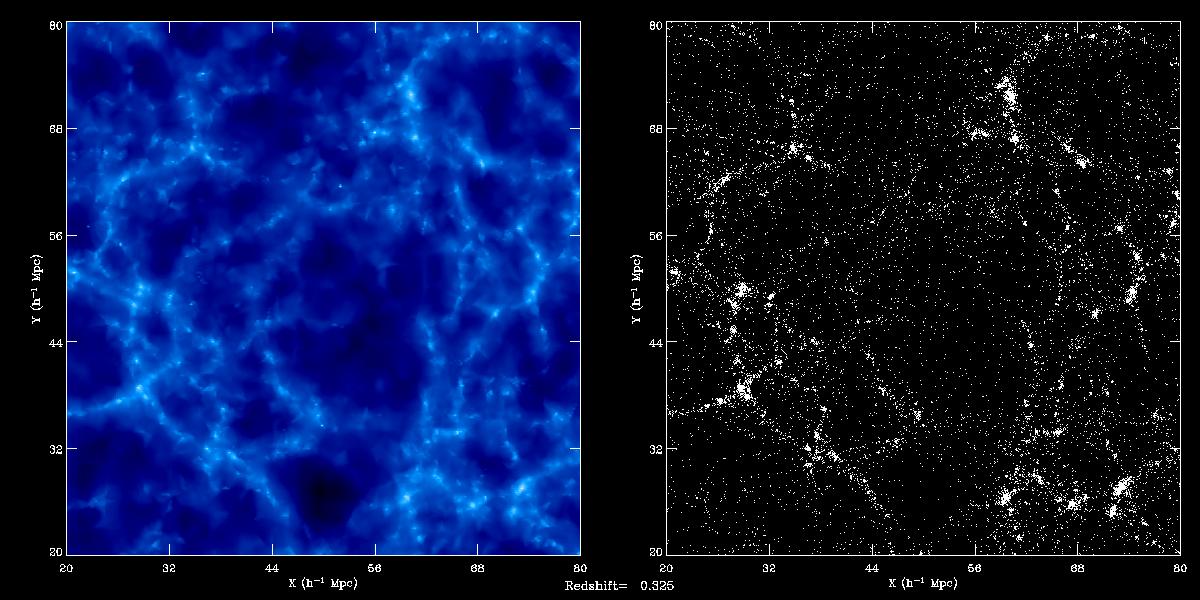
Evolving void in SCDM scenario. Animated gif (click).
Lefthand: DTFE rendering. Righthand: particle distribution
Notice the squeezing of subvoids near the boundary of the central expanding void
Movie 3:
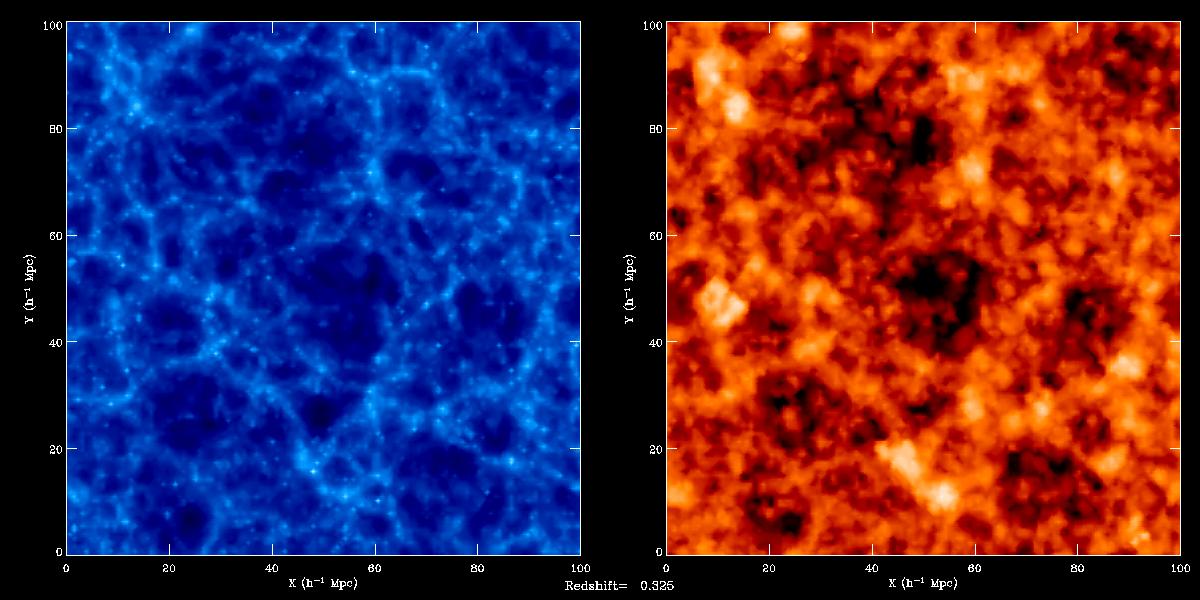
Evolving void in SCDM scenario: gas distribution. Animated gif (click).
Lefthand: gas density. Righthand: gas temperature
Simulations with the help of GADGET SPH code
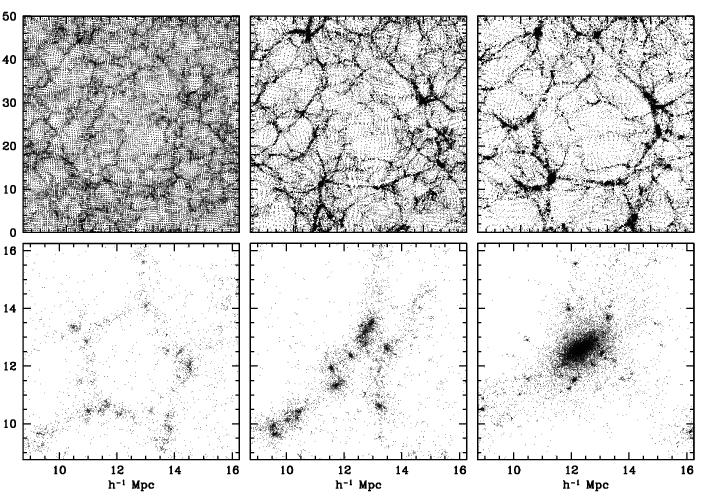
Figure 1. Hierarchical Void Evolution.
Illustration of the two essential ``void hierarchy modes'':
(top) the void-in-void process, with a void growing through the
merging of two or more subvoids; (bottom) the void-in-cloud process:
a void demolished through the gravitational collapse of embedding region.
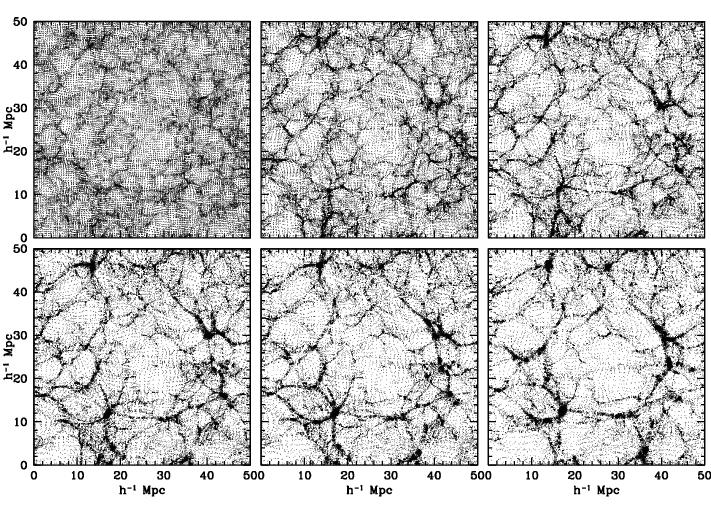
Figure 2. Hierarchical Void Evolution.
A simulation of the development of a SCDM void:
displaying the void-in-void aspect of the evolving void hierarchy.
Six timesteps, from topleft to bottom right.
Figure 3. Void substructure.
A simulation of evolving SCDM void: 3-D image, sequel of 3 zoom-ins
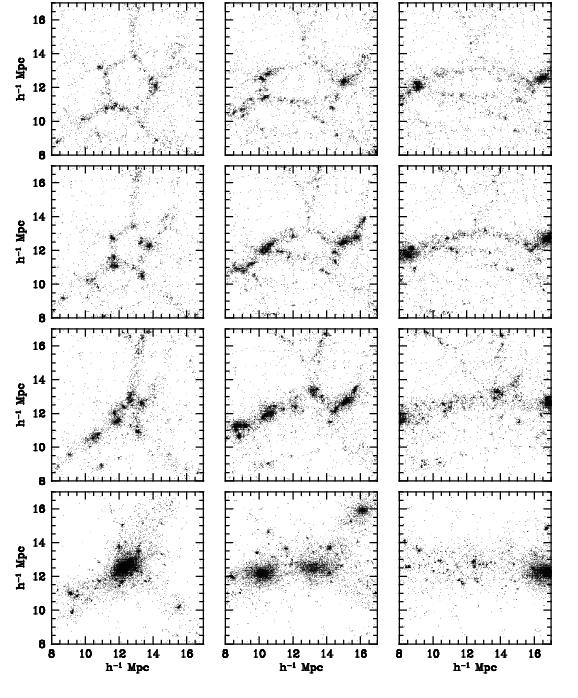
Figure 4. Collapsing Voids.
Three examples from N-body simulations:
the void-in-cloud aspect of the void hierarchy.
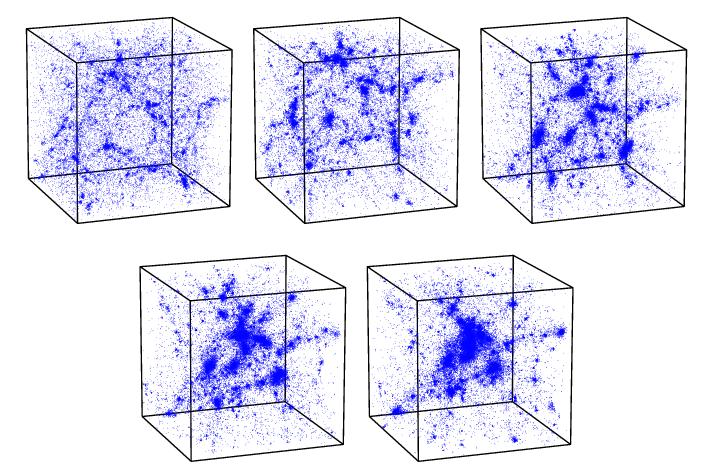
Figure 4. Collapsing Void.
3-D view of collapsing void from N-body simulation.
The void-in-cloud aspect of the void hierarchy.
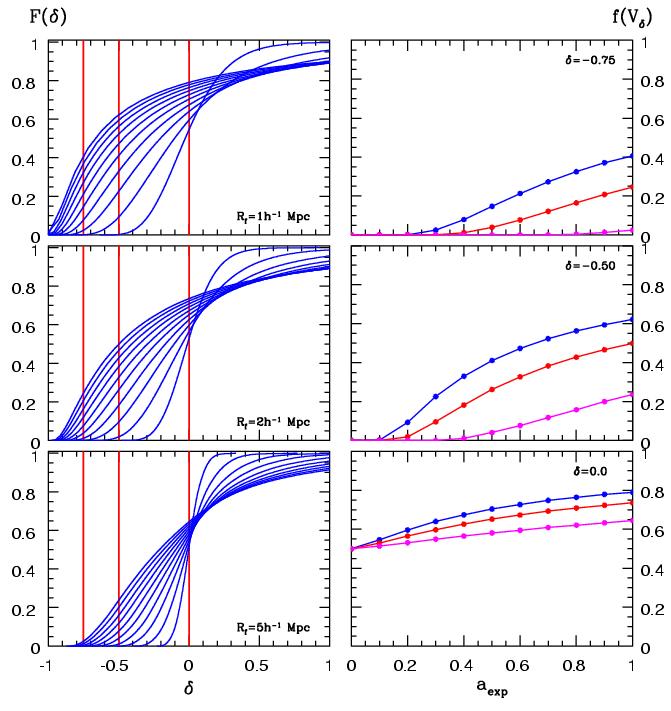
Figure 5. Void growth curves, SCDM simulation
Growth of underdense regions on 3 different spatial scales,
illustrating the sequence of hierarchical evolution of growing underdense regions.
Left: cumulative density distribution functions (pdf's) for 10 timesteps (a=0.1 to 1.0),
for R=1h-1Mpc (top), R=2h-1Mpc (centre) and R=5h-1Mpc (right)
Right: volume occupation for the 3 different spatial scales for 3 different underdensity
values [delta=-0.75, delta=-0.5 and delta=0.0] as a function of expansion factor a(t).
Movie 1:
Superimposed evolving void in 2 cosmological power law power spectrum scenarios
green: delta(R_G)=-2.5; blue: delta(R_G)=-1.5;
voidscale: R_G = 7h^{-1} Mpc, boxlength: 100h^{-1} Mpc
Notice the striking hierarchical evolution of void structure
Animated gif (click)
Movie 2:
Evolving void in SCDM scenario. Animated gif (click).
Lefthand: DTFE rendering. Righthand: particle distribution
Notice the squeezing of subvoids near the boundary of the central expanding void
Movie 3:
Evolving void in SCDM scenario: gas distribution. Animated gif (click).
Lefthand: gas density. Righthand: gas temperature
Simulations with the help of GADGET SPH code
Figure 1. Hierarchical Void Evolution.
Illustration of the two essential ``void hierarchy modes'':
(top) the void-in-void process, with a void growing through the
merging of two or more subvoids; (bottom) the void-in-cloud process:
a void demolished through the gravitational collapse of embedding region.
Figure 2. Hierarchical Void Evolution.
A simulation of the development of a SCDM void:
displaying the void-in-void aspect of the evolving void hierarchy.
Six timesteps, from topleft to bottom right.
Figure 3. Void substructure.
A simulation of evolving SCDM void: 3-D image, sequel of 3 zoom-ins
Figure 4. Collapsing Voids.
Three examples from N-body simulations:
the void-in-cloud aspect of the void hierarchy.
Figure 4. Collapsing Void.
3-D view of collapsing void from N-body simulation.
The void-in-cloud aspect of the void hierarchy.
Figure 5. Void growth curves, SCDM simulation
Growth of underdense regions on 3 different spatial scales,
illustrating the sequence of hierarchical evolution of growing underdense regions.
Left: cumulative density distribution functions (pdf's) for 10 timesteps (a=0.1 to 1.0),
for R=1h-1Mpc (top), R=2h-1Mpc (centre) and R=5h-1Mpc (right)
Right: volume occupation for the 3 different spatial scales for 3 different underdensity
values [delta=-0.75, delta=-0.5 and delta=0.0] as a function of expansion factor a(t).
Figure 3. Void substructure.
A simulation of evolving SCDM void: 3-D image, sequel of 3 zoom-ins
Figure 4. Collapsing Voids.
Three examples from N-body simulations:
the void-in-cloud aspect of the void hierarchy.
Figure 4. Collapsing Void.
3-D view of collapsing void from N-body simulation.
The void-in-cloud aspect of the void hierarchy.