import numpy as np
import pylab

pylab.plt.rcParams["figure.figsize"] = (6, 12)

# np.random.seed(42135)
np.random.seed(52134)
NSOURCES = 7
XYMIN = [0, 0]
XYMAX = [2000, 4000]
XOFFSET = 100
YOFFSET = 200
FWHMNOISE = 20
MAXDISTANCE = 100DMIN, DMAX = 0, int(np.sqrt(XYMAX[0] ** 2 + XYMAX[1] ** 2))
AMIN, AMAX = -180, 180
masterx, mastery = np.random.uniform(XYMIN, XYMAX, [NSOURCES, 2]).T
k = np.arange(NSOURCES)
np.random.shuffle(k)
otherx = masterx[k] + XOFFSET + np.random.normal(0, FWHMNOISE, NSOURCES)
othery = mastery[k] + YOFFSET + np.random.normal(0, FWHMNOISE, NSOURCES)
# Add large offset for one Source
otherx[4] -= 200
othery[4] += 50class Source:
"""2-dimensional point."""
def __init__(self, sid, x, y):
self.sid = sid
self.x = x
self.y = y
def __repr__(self):
return f"({self.x:.1f}, {self.y:.1f})"class SourceList(list):
"""List of Sources."""
@classmethod
def fromxy(cls, xlist, ylist):
result = SourceList()
result.x, result.y = xlist, ylist
for sid, (x, y) in enumerate(zip(xlist, ylist)):
result.append(Source(sid, x, y))
return result
def findallpairs(self):
result = {}
for sourcek in self:
for sourcej in self:
if sourcek.sid != sourcej.sid:
d, a, dx, dy = distanceangle(sourcek, sourcej)
cd, ca = int(d) // 16, int(a) // 4
for u in range(cd-1, cd+2):
for v in range(ca-1, ca+2):
result.setdefault((u, v), set()).add((sourcek.sid, sourcej.sid))
return result
def scatter(self):
pylab.scatter(self.x, self.y, s=10.0)
pylab.xlim(XYMIN[0], XYMAX[0])
pylab.ylim(XYMIN[1], XYMAX[1])def distanceangle(source0, source1, xcorr=0.0, ycorr=0.0):
"""Calculate distance and angles between sources."""
dx = source0.x - source1.x - xcorr
dy = source0.y - source1.y - ycorr
d = np.sqrt(dx * dx + dy * dy)
a = np.degrees(np.arctan2(dy, dx))
# print(d,a)
# breakpoint()
return d, a, dx, dydef findmatchingpairs(apairs, bpairs):
result = set()
for k in apairs:
if k not in bpairs:
continue
for a0, a1 in apairs[k]:
for b0, b1 in bpairs[k]:
result.add((a0, b0))
result.add((a1, b1))
return resultmsl = SourceList.fromxy(masterx, mastery)
osl = SourceList.fromxy(otherx, othery)
msl.scatter()
osl.scatter()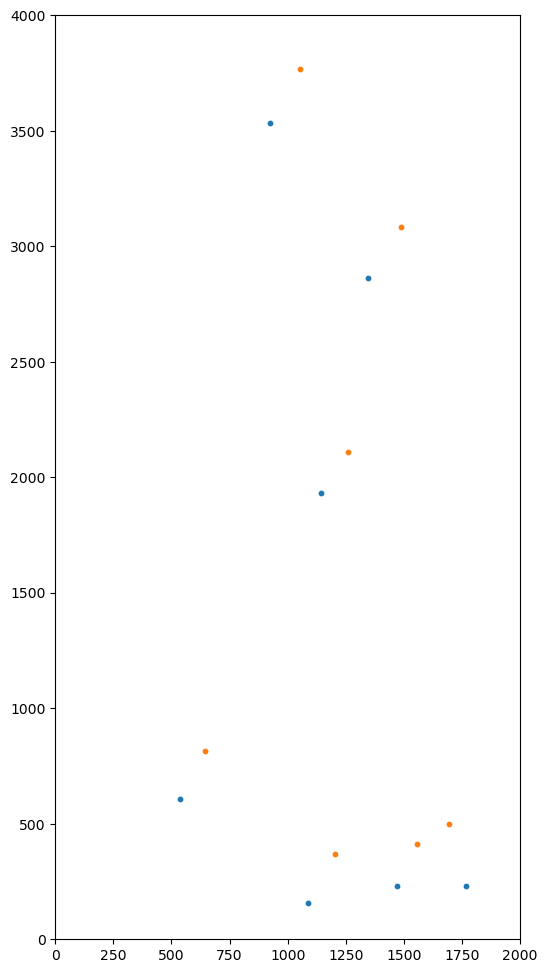
- Find all Pairs of Sources for 2 SourceLists.
- Find Pairs in one SourceList that have the same distance and position angle as Pairs in the other SourceList.
NB. mpairs are Pairs of Sources of a single SourceList. Likewise for opairs. matches are Associations between a Source in mpairs and a Source in opairs.
mpairs = msl.findallpairs()
opairs = osl.findallpairs()
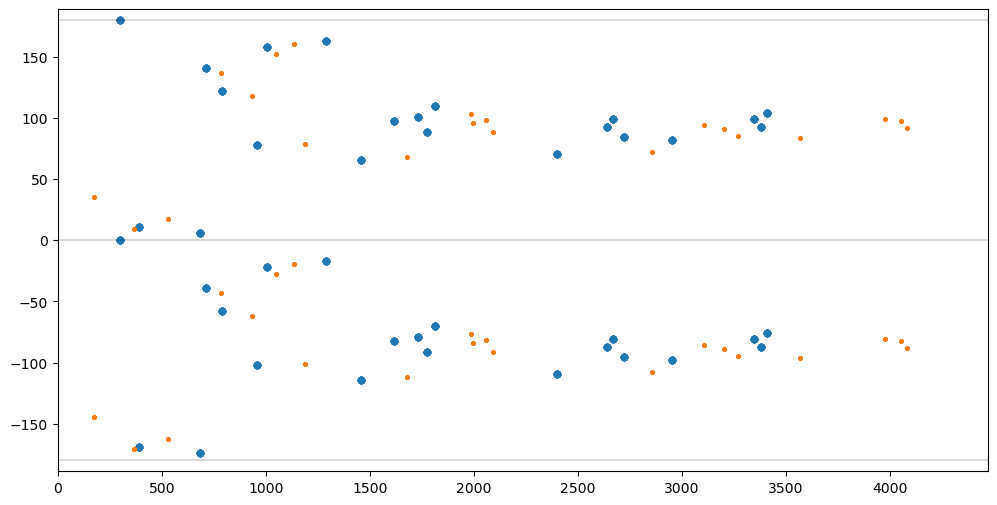
matches = findmatchingpairs(mpairs, opairs)Show distance vs positition angle for all Pairs in both SourceLists.
fig = pylab.figure(figsize=(12,6)).gca()
pylab.xlim([DMIN,DMAX])
pylab.ylim([AMIN*1.05,AMAX*1.05])
pylab.plot([DMIN,DMAX],[-180,-180], color='black', linewidth=0.2)
pylab.plot([DMIN,DMAX],[0,0], color='black', linewidth=0.2)
pylab.plot([DMIN,DMAX],[180,180], color='black', linewidth=0.2)
dlist, alist = [], []
for pairs in mpairs.values():
    for pair in pairs:
        d, a, _, _ = distanceangle(msl[pair[0]], msl[pair[1]])
        dlist.append(d)
        alist.append(a)
fig.scatter(dlist, alist, s=20)
dlist, alist = [], []
for pairs in opairs.values():
    for pair in pairs:
        d, a, _, _ = distanceangle(osl[pair[0]], osl[pair[1]])
        dlist.append(d)
        alist.append(a)
fig.scatter(dlist, alist, s=5);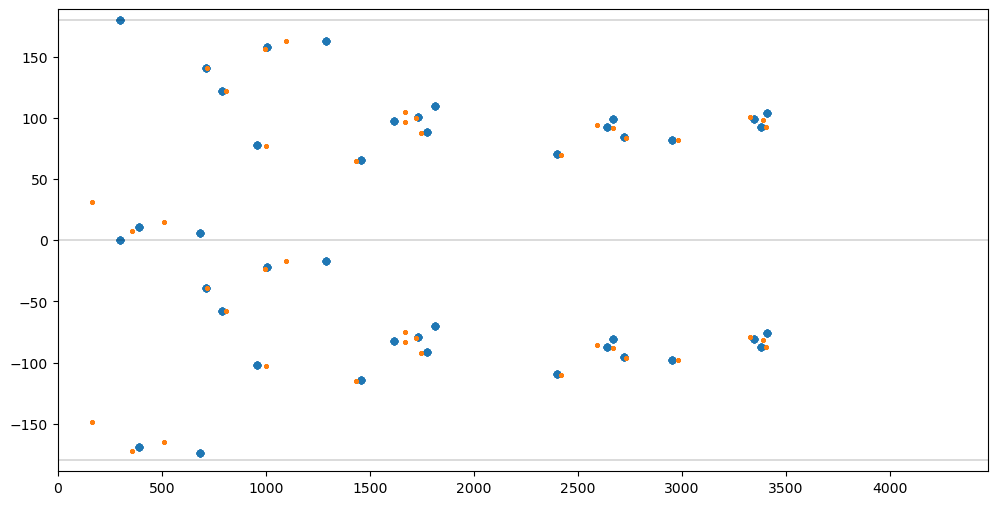
Show Source coordinates, distance, x-offset, and y-offset for all candidate Associations.
for m in matches:
    distance, _, dx, dy = distanceangle(msl[m[0]], osl[m[1]])
    print(f"{m=} {msl[m[0]]=} {osl[m[1]]=} {distance=:.1f} {dx=:.1f} {dy=:1f}")
m=(6, 2) msl[m[0]]=(1347.3, 2864.7) osl[m[1]]=(1486.0, 3083.4) distance=259.0 dx=-138.7 dy=-218.751113
m=(0, 0) msl[m[0]]=(924.0, 3532.0) osl[m[1]]=(1051.7, 3766.6) distance=267.1 dx=-127.7 dy=-234.553600
m=(5, 4) msl[m[0]]=(1468.7, 229.6) osl[m[1]]=(1695.7, 499.6) distance=352.7 dx=-227.1 dy=-269.941399
m=(4, 6) msl[m[0]]=(1087.9, 156.5) osl[m[1]]=(1555.9, 414.3) distance=534.3 dx=-468.1 dy=-257.783028
m=(3, 3) msl[m[0]]=(1143.6, 1931.3) osl[m[1]]=(1259.3, 2111.3) distance=214.0 dx=-115.7 dy=-180.049720
m=(5, 6) msl[m[0]]=(1468.7, 229.6) osl[m[1]]=(1555.9, 414.3) distance=204.2 dx=-87.3 dy=-184.672663
m=(1, 6) msl[m[0]]=(1765.0, 228.8) osl[m[1]]=(1555.9, 414.3) distance=279.6 dx=209.1 dy=-185.557323
m=(2, 5) msl[m[0]]=(535.0, 605.9) osl[m[1]]=(644.6, 814.9) distance=236.0 dx=-109.6 dy=-209.027027
m=(4, 1) msl[m[0]]=(1087.9, 156.5) osl[m[1]]=(1202.7, 367.6) distance=240.3 dx=-114.8 dy=-211.048858Plot all candidate Associations, including false positives
pylab.xlim(XYMIN[0], XYMAX[0])
pylab.ylim(XYMIN[1], XYMAX[1])
for j, k in matches:
    m, o = msl[j], osl[k]
    acount = sum(1 for u, v in matches if u == j)
    bcount = sum(1 for u, v in matches if v == k)
    if acount > 1:
        pylab.arrow(o.x, o.y, m.x - o.x, m.y - o.y, head_width=30, color="red")
    elif bcount > 1:
        pylab.arrow(o.x, o.y, m.x - o.x, m.y - o.y, head_width=30, color="blue")
    else:
        pylab.arrow(o.x, o.y, m.x - o.x, m.y - o.y, head_width=30, color="magenta")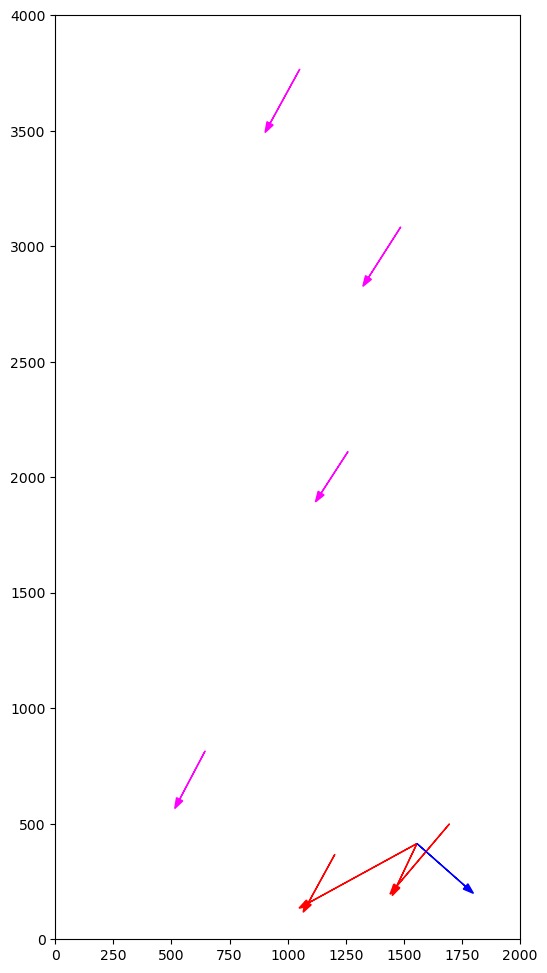
Use the x-offset and y-offset from each candidate Association to find the ones with the maximum number of Associations within MAXDISTANCE. The Associations are likely correct if more than half of the Sources are within MAXDISTANCE after correction.
associations = set()
for j, k in matches:
    distance, angle, xcorr, ycorr = distanceangle(msl[j], osl[k])
    print(f"{len(matches)} {distance=:.1f} {angle=:.1f} {xcorr=:.1f} {ycorr=:.1f}")
    ncandidates = 0
    for u, v in matches:
        distance, _, _, _ = distanceangle(msl[u], osl[v], xcorr, ycorr)
        if distance < MAXDISTANCE:
            ncandidates += 1
    if 2 * ncandidates > NSOURCES:
        print(
            f"Yes {ncandidates}/{NSOURCES} {distance=:.1f} {angle=:.1f} {xcorr=:.1f} {ycorr=:.1f}"
        )
        associations.add((j,k))
    else:
        print(
            f"No! {ncandidates}/{NSOURCES} {distance=:.1f} {angle=:.1f} {xcorr=:.1f} {ycorr=:.1f}"
        )
9 distance=259.0 angle=-122.4 xcorr=-138.7 ycorr=-218.8
Yes 6/7 distance=25.1 angle=-122.4 xcorr=-138.7 ycorr=-218.8
9 distance=267.1 angle=-118.6 xcorr=-127.7 ycorr=-234.6
Yes 6/7 distance=26.8 angle=-118.6 xcorr=-127.7 ycorr=-234.6
9 distance=352.7 angle=-130.1 xcorr=-227.1 ycorr=-269.9
No! 1/7 distance=126.8 angle=-130.1 xcorr=-227.1 ycorr=-269.9
9 distance=534.3 angle=-151.2 xcorr=-468.1 ycorr=-257.8
No! 1/7 distance=356.3 angle=-151.2 xcorr=-468.1 ycorr=-257.8
9 distance=214.0 angle=-122.7 xcorr=-115.7 ycorr=-180.0
Yes 6/7 distance=31.0 angle=-122.7 xcorr=-115.7 ycorr=-180.0
9 distance=204.2 angle=-115.3 xcorr=-87.3 ycorr=-184.7
Yes 6/7 distance=38.1 angle=-115.3 xcorr=-87.3 ycorr=-184.7
9 distance=279.6 angle=-41.6 xcorr=209.1 ycorr=-185.6
No! 1/7 distance=324.9 angle=-41.6 xcorr=209.1 ycorr=-185.6
9 distance=236.0 angle=-117.7 xcorr=-109.6 ycorr=-209.0
Yes 6/7 distance=5.6 angle=-117.7 xcorr=-109.6 ycorr=-209.0
9 distance=240.3 angle=-118.5 xcorr=-114.8 ycorr=-211.0
Yes 6/7 distance=0.0 angle=-118.5 xcorr=-114.8 ycorr=-211.0Print Associations with Distance, Angle, and Offset After Correction and plot them.
pylab.xlim(XYMIN[0], XYMAX[0])
pylab.ylim(XYMIN[1], XYMAX[1])
for j, k in associations:
    m, o = msl[j], osl[k]
    distance, angle, dx, dy = distanceangle(msl[j], osl[k], xcorr, ycorr)
    print(f"!!! ({j},{k}) {distance=:.1f} {angle=:.1f} {dx=:.1f} {dy=:.1f}")
    pylab.arrow(o.x, o.y, m.x - o.x, m.y - o.y, head_width=30, color="green")
!!! (6,2) distance=25.1 angle=-162.1 dx=-23.9 dy=-7.7
!!! (0,0) distance=26.8 angle=-118.7 dx=-12.9 dy=-23.5
!!! (3,3) distance=31.0 angle=91.7 dx=-0.9 dy=31.0
!!! (5,6) distance=38.1 angle=43.7 dx=27.6 dy=26.4
!!! (2,5) distance=5.6 angle=21.1 dx=5.2 dy=2.0
!!! (4,1) distance=0.0 angle=0.0 dx=0.0 dy=0.0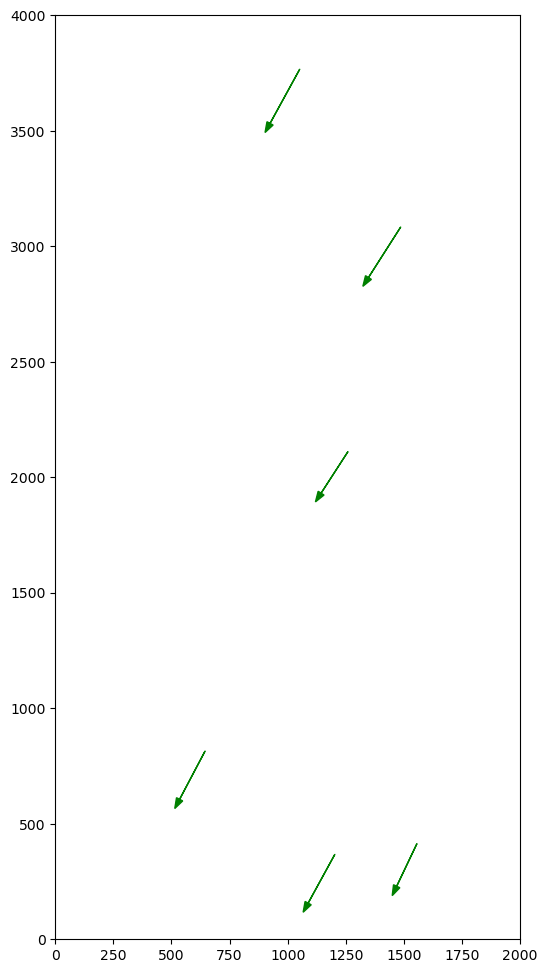
Rotating one SourceList will lead to an offset along the angle axis w.r.t to another SourceList
rota = pylab.radians(30)
tmpx = otherx * pylab.cos(rota) - othery * pylab.sin(rota)
tmpy = otherx * pylab.sin(rota) + othery * pylab.cos(rota)

osl = SourceList.fromxy(tmpx, tmpy)

opairs = osl.findallpairs()

fig = pylab.figure(figsize=(12,6)).gca()
pylab.xlim([DMIN,DMAX])
pylab.ylim([AMIN*1.05,AMAX*1.05])
pylab.plot([DMIN,DMAX],[-180,-180], color='black', linewidth=0.2)
pylab.plot([DMIN,DMAX],[0,0], color='black', linewidth=0.2)
pylab.plot([DMIN,DMAX],[180,180], color='black', linewidth=0.2)

dlist, alist = [], []
for pairs in mpairs.values():
    for pair in pairs:
        d, a, _, _ = distanceangle(msl[pair[0]], msl[pair[1]])
        dlist.append(d)
        alist.append(a)
fig.scatter(dlist, alist, s=20)

dlist, alist = [], []
for pairs in opairs.values():
    for pair in pairs:
        d, a, _, _ = distanceangle(osl[pair[0]], osl[pair[1]])
        dlist.append(d)
        alist.append(a)
fig.scatter(dlist, alist, s=5);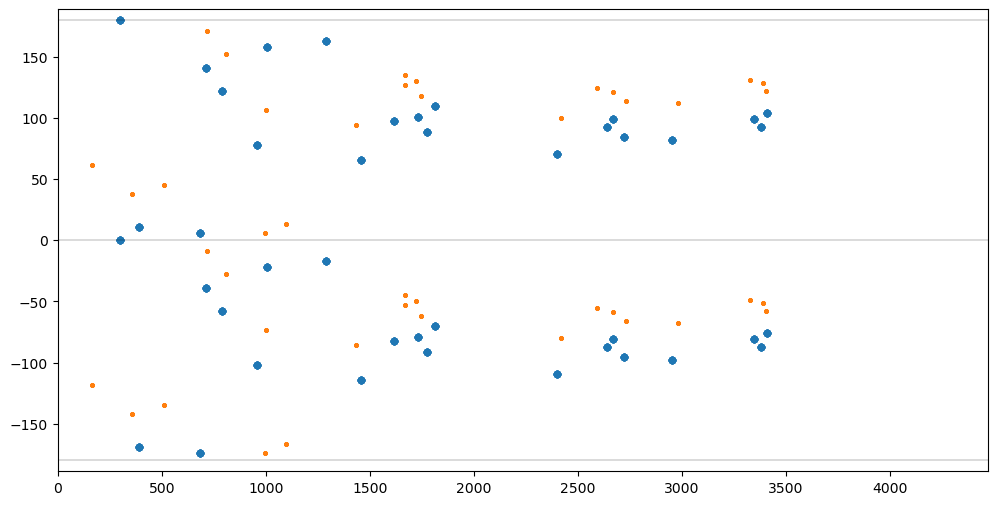
Scaling both x and y coordinates of a SourceList will lead to a scale difference along the distance axis w.r.t to another SourceList and an offset along the angle axis.
tmpx = 1.02 * otherx
tmpy = 1.2 * othery

osl = SourceList.fromxy(tmpx, tmpy)

opairs = osl.findallpairs()

fig = pylab.figure(figsize=(12,6)).gca()
pylab.xlim([DMIN,DMAX])
pylab.ylim([AMIN*1.05,AMAX*1.05])
pylab.plot([DMIN,DMAX],[-180,-180], color='black', linewidth=0.2)
pylab.plot([DMIN,DMAX],[0,0], color='black', linewidth=0.2)
pylab.plot([DMIN,DMAX],[180,180], color='black', linewidth=0.2)

dlist, alist = [], []
for pairs in mpairs.values():
    for pair in pairs:
        d, a, _, _ = distanceangle(msl[pair[0]], msl[pair[1]])
        dlist.append(d)
        alist.append(a)
fig.scatter(dlist, alist, s=20)

dlist, alist = [], []
for pairs in opairs.values():
    for pair in pairs:
        d, a, _, _ = distanceangle(osl[pair[0]], osl[pair[1]])
        dlist.append(d)
        alist.append(a)
fig.scatter(dlist, alist, s=5);