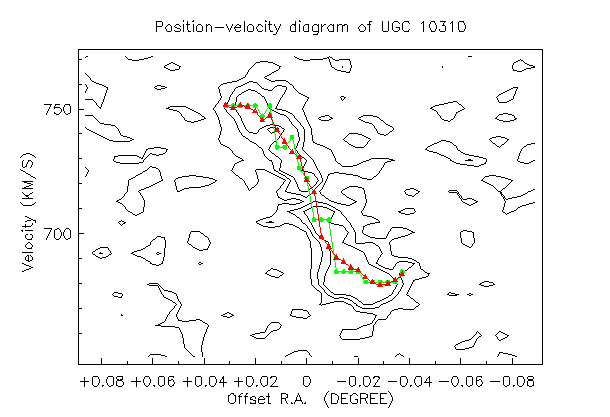
GPLOT recipes: Position-velocity diagram

The image shows a XV-diagram with a profile overlay. The XV contour plot
represents data that is extracted from a data cube with program SLICE.
The profile data is extracted from a cube that was made with program MOMENTS.
In this recipe, we will explain how the plots are scaled.
The GPLOT macro:
With program SLICE you create a new data cube with a width equal to
the number of sample points in the slice, height equal to the number of
slices and depth equal to the number of velocities. An 'XV' diagram can
be plotted after you selected a subset at a certain declination (which is
not a real declination anymore after SLICE). The (sliced) input in our
example is: inset sliceset d 0. Program SLICE displays for
each slice the start and end position of the slice. This information
is also stored in a GDS-table in the header of the set made by SLICE.
The column names are SLXMIN, SLXMAX, SLYMIN, SLYMAX. In this example
SLICE displayed Slice #1 starts at (-16 -60) and ends at (16 61).
These are numbers that we have to remember if command profile
is going to be used to overlay other data.
Two subsets, containing velocity information, were produced by MOMENTS.
The first one is subset inset u10310s30-2dim 3. It contains
velocities measured at peaks in the velocity profiles (in the same original
data cube used in SLICE).
Subset inset u10310s30-2dim 7 contains intensity weighted mean
velocities. If you want to overlay data in these subsets taken along the same
slice as used in SLICE, then we need the profile command followed by
prodata to copy . It is
necessary to use the profile command with the same start and end
point as the grid positions between which the slice was taken.
Here are the commands:
erase                           ! Clear screen
colour foreground               ! Default colour is foreground colour
inset sliceset d 0              ! XV diagram taken from slice.
box -64 650 km/s 63 770 km/s    ! Limits for that XV diagram
The box command needs some attention here. The range in x-direction
must be the full axis length. This is important because start and end point
of slice and profile in x direction must coincide. The limits in y direction
are arbitrary. They have to correspond with the range in profile y values.
But for the profile, the y values are stored as physical coordinates (velocities)
so in the box command the y limits are entered as numbers followed by
the physical units of the y axis.
level 0.8 2 3                   ! Contours for XV
xsize 120                       ! Size in x is 120 mm
ysize 80
frame                           ! Plot the axis with default labels
conto                           ! Plot the contours
inset u10310s30-2dim 3          ! First subset to extract profile from
profile -16 -60 16 61           ! Start end end point of profile
profdata                        ! Copy profile data in xcolumn & ycolumn
colour green
xrange xcolumn                  ! Limits are min/max of xcolumn data
xsize 120                       ! Scale this length also to 120 mm !!!
yrange 650 770                  ! Limits in y
ysize 80
symbol 17                       ! Filled dot
points                          ! Plot the points in this profile
connect                         ! Connect all non blank profile points
inset u10310s30-2dim 7          ! Second subset (int. weighted mean vel.)
profile -16 -60 16 61
profdata                        ! Copy profile data in xcolumn & ycolumn
colour red
symbol 13                       ! Filled triangle
xrange xcolumn
xsize 120
yrange 650 770
ysize 80
points
connect


