Theoretical S/N plots for OmegaCAM/VST
The figures below show the point source S/N that is expected in
OmegaCAM images, based on the theoretical and measured (where
available) efficiencies of the whole system. All simulations are for
flat-spectrum sources. Assumptions made:
- 3 arcsec circular aperture; all object flux falls inside aperture.
- Read noise 5e- per pixel; longest single exposure 1800 sec
- No flat-field errors are taken into account
- Observations taken through 1 airmass
- KPNO sky spectrum, scaled to Paranal's quoted V=21.8 dark sky
- VST throughput as taken from design documents
- OmegaCAM throughput taken from measured CCD QE, as-designed filter throughput.
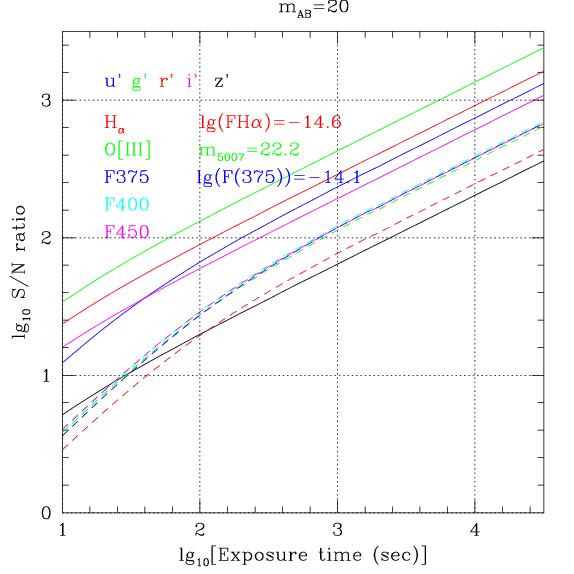
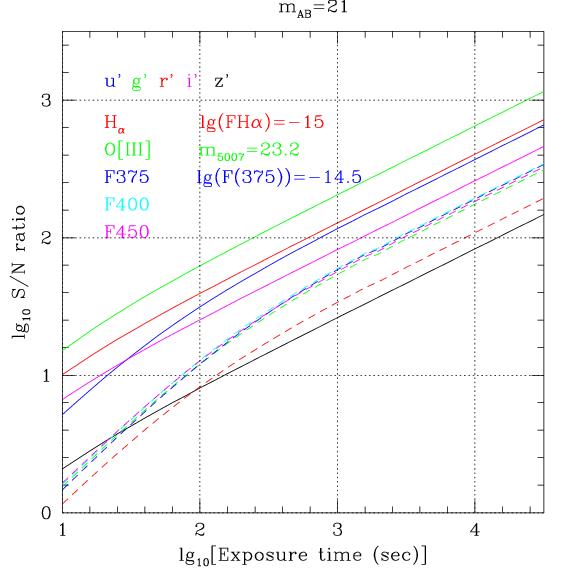
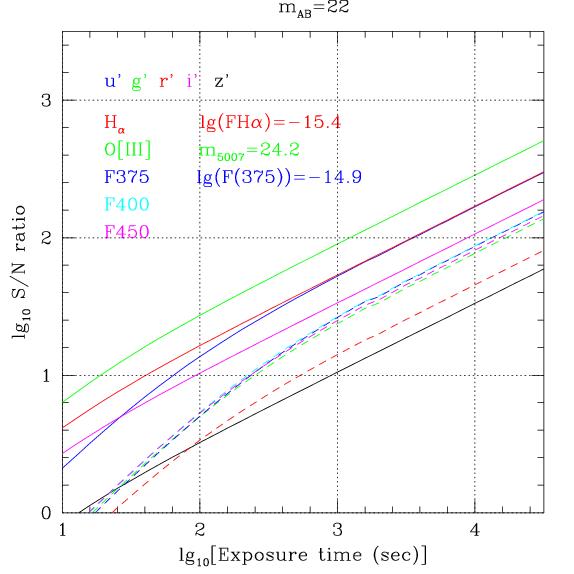
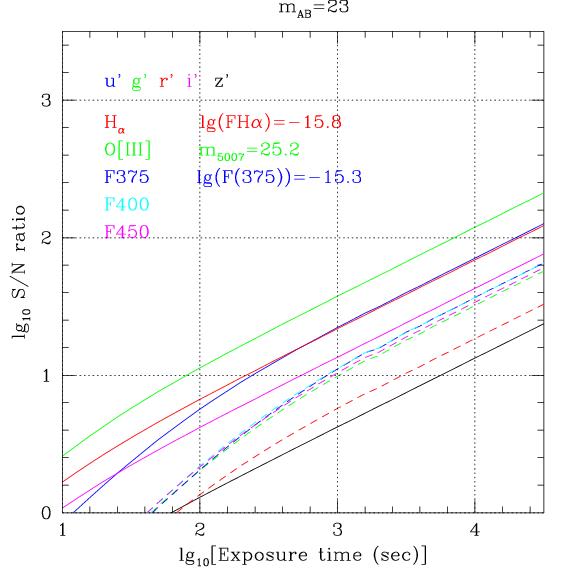
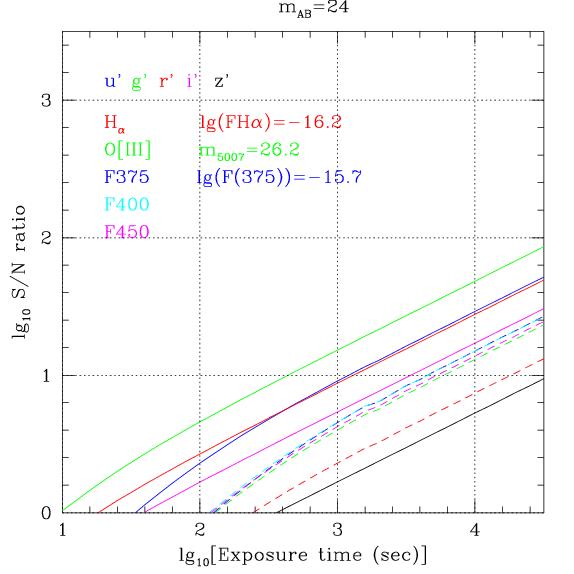
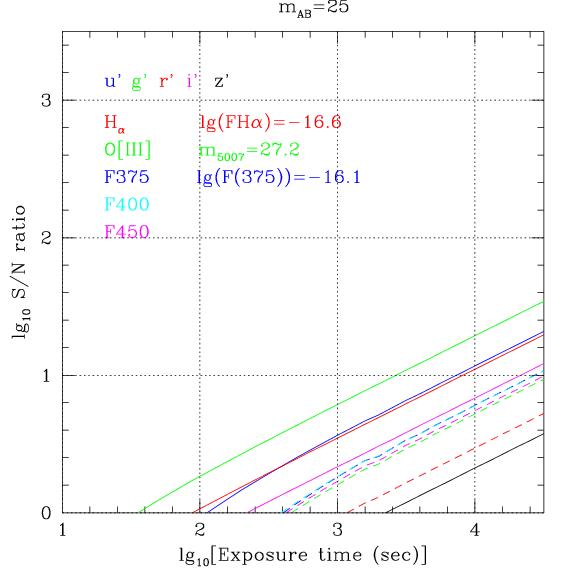
Filters plotted are the SDSS broad-band set, as well as Halpha (on
order) and a 4-filter mosaic of narrow-band (10nm) filters centered in
375, 400, 450 and 503 nm currently being considered. For the
narrow-band filters, AB magnitudes have been converted into the
equivalent line fluxes in each plot.
S/N plots for the main OmegaCAM filters. Solid lines refer to
broad-band filters, dashed lines to the narrow-band filters.
|
 |
 |
 |
 |
 |
 |