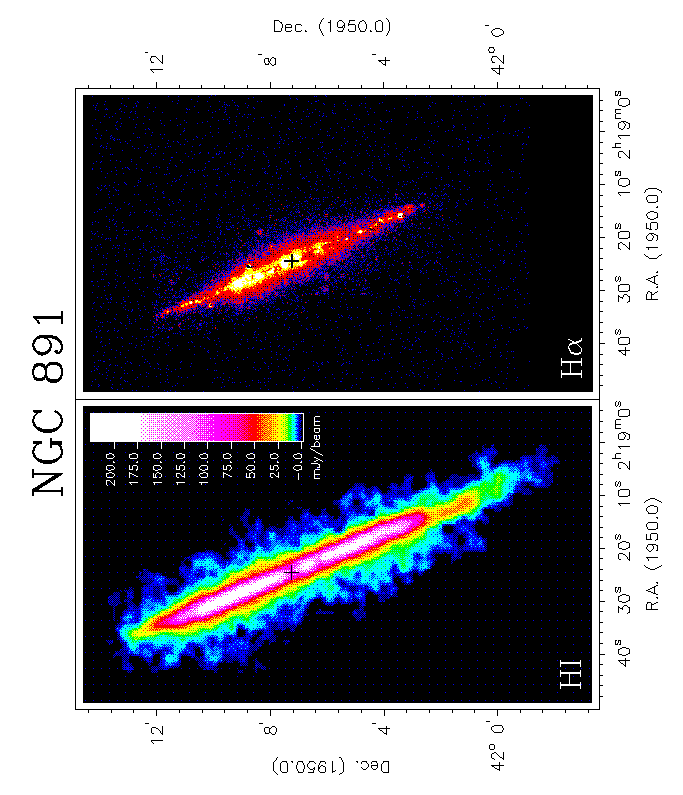

GPLOT recipes: A colour panel demo

 getlut                               ! Freeze lut in GIDS
 inset mom891_20blot5 p 0             ! The set in the left panel
 box -40 -155 85 60                   ! Limits of its frame
 location 30 20                       ! Lower left point in mm
 xscale 1.5
 yscale 1.5
 xmargin 2                            ! Grid margin in X direction
 ymargin 2
 colplot                              ! Write image to colour device
 lwidth 2                             ! Set the line width
 axformat hmS                         ! Always write the seconds
 axpos * 2 19 0                       ! Write longest label at 2h19m0s
 axis bp                              ! Write bottom axis with phys. coords.
 axtitle                              ! Plot the name of this axis
 axdelta 4 arcmin                     ! Tick separation in declination
 axis lp
 axis r
 axis t
 move -65 -70
 angle 90
 text Dec. (1950.0)
 angle 0
 move -35 -150
 colour 0
 font roman
 charheight 6.8
 text HI
The colour bar in the plot is almost a copy of the colour bar that you saw while using VIEW. The position of the bar is set to the current pen position. The bar is plotted with command colbar with two arguments: the width and the height both in millimeters.
 font 1
 move 70 -33
 charheight 2.8
 colbar 8 60                          ! The colour bar with numbers
 move 54 -40
 text mJy/beam                        ! Text just beneath the bar
 charheight 4
 colour 1
 move 12 -28                          ! Plot a big '+' character
 draw 18 -28
 move 15 -25
 draw 15 -31
 location 117.5 20
 axdelta 4 arcmin
 axis rp
 axis t
 axformat hmS
 axpos * 2 19 0
 axis bp
 axtitle
 move 112 -20
 angle -90
 text Dec. (1950.0)
 angle 0
Now it is time to display the next set in GIDS (use VIEW again and set the lut). But therefore we have to stop GPLOT for a while. The command pause prompts with a dummy keyword. Type <ctrl> U to clean the input area and start VIEW. Display the second set and adjust colours etc. Then press the spacebar to get back the GPLOT prompt and press a key to start executing again.
 pause                                ! Pause GPLOT to use VIEW again
 inset n891.ha.astrom.big
 overbox                              ! Calculate a box for this set
 getlut                               ! Fix the lut
 overlay yes                          ! Set scales so that physical positions
                                      ! coincide
 colplot                              ! create the colour plot
 move -210 -505
 font 2
 charheight 6.8
 colour 0
 text H\ga
 colour 1
 charheight 10.0
 font 2
 lwidth 4
 move -420 410
 text NGC 891
 colour 1
 move -1 17
 draw -1 -7
 move -13 5
 draw 11 5
