
GPLOT recipes:Plotting profiles in GPLOT (II)

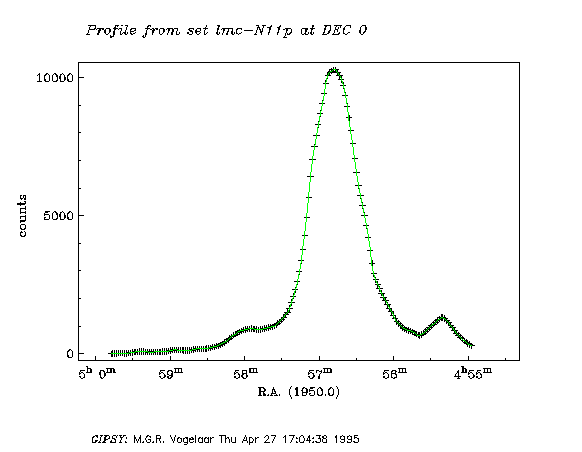
The ranges are set with xrange and yrange with the column names as arguments. The sizes are set in mm with xsize and ysize. In the plot above, we wanted to plot profile data along a RA axis at DEC=0 in a 2-dimensional data set: lmc-N11p. There are two possible input combinations. First is to give the set name only (so that the dimension of the input is 2). The input did not fix a profile axis so you need to specify a start and an end point with command: profile RAlo DEClo RAhi DEChi (e.g.:profile -10 0 10 0). The disadvantage of this method is that you have to know the values of RAlo and RAhi beforehand. The second method is an input with a subset axis wich is interpreted as the profile (inset lmc-N11p RA) and a profile position (profile 0 [subset dimension is 1]) as shown in the next macro:
! Example of profile extracted from 2-dim set
colour default        ! Set foreground colour
font 2                ! Font is roman
location 30 40        ! Location of lower left edge in mm
charheight 3.5        ! Character height in mm
inset lmc-N11p RA     ! A profile in RA direction
profile 0             ! Select profile at dec = 0
profdata              ! Store extracted data in xcolumn, ycolumn
xrange xcolumn        ! Min, max from xcolumn
yrange ycolumn        ! Min, max from ycolumn
xmargin 2
ymargin 2
xsize 120             ! Width of plot is 120 mm
ysize 80              ! Height of plot is 80 mm
axpos * 4 55 0        ! Start first coordinate label at 4h55m
profaxis bp           ! Draw profile axis (and physical labels) at the bottom.
axtitle               ! A default title
axis lw
axtitle counts
axis t
axis r
points                ! Plot the profile points
colour green
connect               ! Connect the profile points
mmeter                ! Switch to mm mode
move 30 15
charheight 3
colour default
id                    ! Plot user identification and date
move 30 130
charheight 4
font italic
text Profile from set lmc-N11p at DEC 0
world                 ! Back to world coordinates
Note that for plotting profiles also command pplot can be used. This command generates keyword prompts to guide you through all kind of input problems.
