J. CHOLONIEWSKI
Astronomical Observatory of the Warsaw University, Poland
EDWIN A. VALENTIJN
ESO and SRON Space Research Organization Netherlands, Groningen
Download Postscript colormap

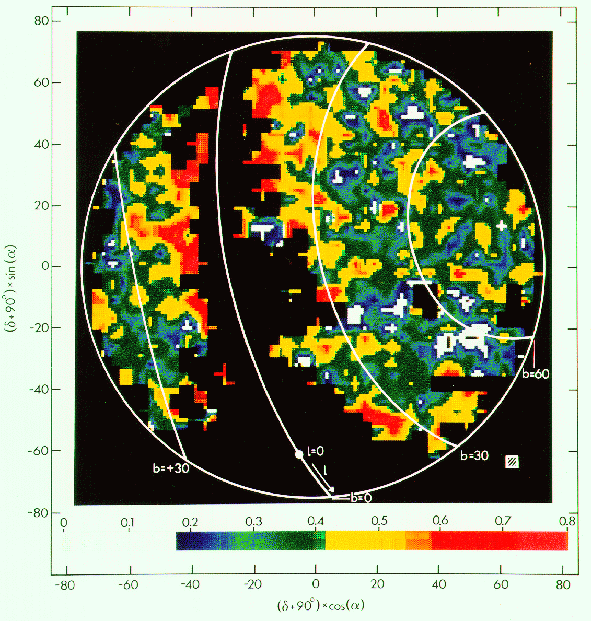
Fig.1 The map of the relative extinction in the B band in polar equatorial
coordinates. Our results for extinction have
been averaged inside 3 x 3 degree pixels and are displayed here
using 1.5 x 1.5 degree pixels -- some interpolation have been
applied to fill pixels without data (~5% of total). The credibility
of apparent structures can be assessed by using the following information:
the uncertainty of A_B inside one resolution element (inset box at the lower
right) is 0.13mag, roughly corresponding to the step of one colour on the map.
The zero point is somewhat arbitrary, but a lower limit could be deduced
by avoiding negative
extinctions in regions with a minimum extinction not at the South Pole)
and a deconvolution of the observed frequency distribution of A_B with
the measurement error function.
TEXT of PAPER PRINTED in 1991, in ESO Messenger 63,1
Download Postscript reprint
Introduction
The precise surface brightness values listed for about 12000
homogeneously selected galaxies in
"The Surface Photometry Catalogue of the ESO-Uppsala Galaxies, 1989"
(Lauberts and Valentijn 1989, hereafter ESO-LV; see also Messenger
34, 10 and 56, 31) have been used to derive
Galactic extinction values for a large part of the Southern Sky. The new
extinction measures are thought to reflect the effect of the
diffuse interstellar medium in our own Galaxy and the technique
we have employed should trace the same component as has been studied
before in so-called 'reddening' studies. The current analysis uses parameters
of detected galaxies, in similarity with previous reddening studies,
and is not sensitive to those regions of the sky that might be that
heavily obscured that we start to miss objects located behind these regions.
These heavily obscured regions can be better traced by galaxy counts,
a separate project, which is still in progress.
Here, we announce some first results of our extinction studies, that
resulted in a 3 degree resolution extinction map of the Southern Sky
with a sigma (A_B) ~0.13mag and
sigma (E(B-V)) ~0.06mag.
The Technique
The hitherto most frequently used model for the extinction in the
Southern Galactic hemisphere (Burstein, Heiles) is exclusively based
on the mapping of neutral hydrogen. Since this mapping was done with
a rather poor spatial sampling, the resultant extinction map was grossly
dominated by interpolations of data. Furthermore, using HI data relies
on a constant HI to extinction ratio. The overall value of this
ratio is uncertain by at least a factor two, and is thought to deviate more
locally. This motivated Burstein and Heiles also to include galaxy
counts, when deriving their extinction model for the
Northern Hemisphere, which unfortunately could not be done for the South.
Motivated by the recent availability of the photometric data in the ESO-LV
catalogue we have started some statistical experiments to see whether
the data would allow an improvement on this situation.
Although the surface brightness of an external galaxy at a particular
single band should respond linear to the extinction in the Galaxy,
such single band surface brightness values
are not a good extinction indicator, since they have a too large
scatter around the mean value (sigma ~0.6 mag).

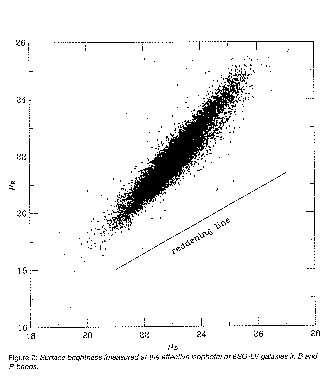
Fig.2 Surface brightness (measured at the effective isophote)
of ESO-LV galaxies in B and R bands.
If however, we have a sample of galaxies with measured surface brightness
in two bands (B and R for ESO-LV), then we can take into
account the fact that they are strongly
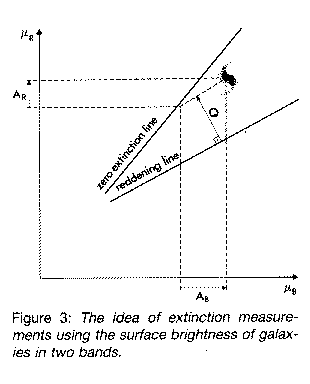
correlated with each other (Fig.2) and use as a measure of
extinction of each individual galaxy, its distance from the average regression
curve of unreddened surface brightnesses, measured along the
direction of the reddening vector (see Fig.3).
However, in order to obtain this distance we have to know the location of
the curve
describing the unreddened surface brightnesses,
but to obtain this curve we have to know extinction for every galaxy --
just the set of values we are looking for.
The only solution of this difficulty is to obtain both
the extinctions and the location of the curve simultanously - in one step.
This is possible with help of the ''analysis of variance'' statistical
technique. This technique reproduced the
well documented ratio A_R/A_B =0.565 and in the further processing
this value has been adopted. In constructing the unreddened curve we
made use of the parameter Q which is independent of extinction
but dependent on surface brightness.
In short, the statistical analysis solves the function f(Q) and
A_B(l,b) in one step.
The introduction of the Q parameter is closely related
to a similar parameter used for the analysis of the reddening of stars.

The uncertainty of the derived extinction
in the B band is sigma (A_B) ~ 0.4mag per galaxy.
This corresponds to sigma (E(B-V)) ~ 0.1mag which is comparable
to the accuracy of extinction estimates deduced from the photometry
of stars. When averaging over larger areas (ESO-LV has about one galaxy
per square degree) a formal much more accurate value for such an area
can be obtained. For instance, the average A_B over one ESO sky
survey plate has been deduced with an error of 0.1mag, which
corresponds to an uncertainty in E(B-R) ~0.04.
Such values are useful to evaluate the large scale distribution
of the extinction, but indeed, we do not know how much spatial structure is
present within these averaged areas, a problem inherent in this sort of
research.
The map
In figure 1 we present a map of the relative extinction in the
Southern Hemisphere.
The photometry of external galaxies can not provide absolute extinction,
or in other words, it can not provide the zero point.
Formally, the technique provides the relative extinction compared to
an overall mean of A_B=0.
We have not finalized the constant yet (our work on this is still in
progress) but we can easily deduce a lower limit for it.
We can not allow negative extinctions to occur (the white and blue
regions in fig 1) and more formally,
we can deconvolve the observed frequency distribution of A_B with
the formal sigma A_B error function.
This way, we derive a lower limit to the zero point of 0.4mag, which
has been included in the scale of figure 1.
Our understanding of fig. 1 is that most of the structures that can
be seen are real. We checked that they do not correlate with the spatial
distribution
of the target galaxies, while around the Southern Galactic pole we could
observe a good spatial correspondence with the IRAS cirrus maps of
Boulanger et al. We can also compare the extinction in a small,
but still significantly large,
part of the Northern Galactic Hemisphere (92 ESO survey plates)
with that in the Southern Galactic Hemiphere. In the regions of
absolute galactic latitute in the range 10-30 degrees, we find on average
about 0.1 mag more extinction (A_B) in the South.
When our evaluation of the lower limit on the zero-point is correct,
then the average extinction at low galactic latitutes (<70 degrees)
should be A_B>0.25mag.
Availability of the data, as of 14 Januari 1998
Our results for the relative extinction in the B band (A_B) in our Galaxy
are available in the following forms:
The file ex_b_av.bin contains average extinction for every pixel on the X,Y plane, where:
X = (Dec.+90)*COS(R.A.) (in 'degrees')
Y = (Dec.+90)*SIN(R.A.) (in 'degrees')
The total number of pixels is equal to 50*50=2500 (50 bins on both axes). [But several pixels do not contain galaxies - see NOTE/**/ below]
Pixel size is 3 x 3 (in 'degrees').
X and Y range is between -75 and +75 ('degrees')
The X,Y coordinates for the pixel with index IX,IY are:
X = -75 + 3*(IX-1) + 1.5
Y = -75 + 3*(IY-1) + 1.5
The format of ex_b_av.bin is (1341 lines):
column format name meaning
(1) I3 IX number of pixel along X axis (IX=1,...,50)
(2) I3 IY number of pixel along Y axis (IY=1,...,50)
(3) F6.2 E(IX,IY) extinction in B band in IX,IY pixel /*/
(4) F6.2 SE(IX,IY) standard deviation of E(IX,IY),
NOTE/*/: extinction listed in column (3) has arbitrary 'zero point' - - to obtain true extinction one should add an unknown (yet) constant.
NOTE/**/: pixels which are not listed contain no galaxies so the extinction for them is unknown.
Download the ASCII file ex_b_av.bin
(1) F8.3 R.A.
(2) F8.3 Dec.
(3) F6.2 Extinction in B band /*/
NOTE/*/: extinction listed in column (3) has arbitrary 'zero point' - to obtain true extinction one should add an unknown (yet) contant. Standard deviation of individual extinction value is equal to 0.45 .
Download the ASCII file ex_b.bin
Other ESO-LV related papers, with links to ADS:
Automatic parameter extraction for the 16000 galaxies in the
ESO/Uppsala catalogue
A. Lauberts, E.A. Valentijn
1983, ESO Messenger 34, 10.
Photographic Photometry of 16000 Galaxies on ESO blue and red
Survey Plates
A. Lauberts and E.A. Valentijn
1985, Proc. of Toulouse meeting on "Galaxy photometry", Reidel Publ. Comp., p 73
Standard Photometric Diameters, of Galaxies. III
G. Paturel, P. Fougue, A. Lauberts, E.A. Valentijn, H.G. Corwin, G. de
Vaucouleurs
1987, Astron. and Astrophys. 184, 86
The ESO-LV project
A. Lauberts, E.A. Valentijn
1987, Proc. of the ECF-Space Telescope conference "Astronomy from
Large Databases" Garching bei Munchen, Edited by F.Murtagh and A.Heck, p37
 The Surface Photometry Catalogue of the ESO-Uppsala Galaxies
A.Lauberts and E.A.Valentijn
1989, Book Published by ESO, june 1989
The Data of the Surface Photometry Catalogue of the ESO-Uppsala
Galaxies are now available
A. Lauberts, E.A. Valentijn
1989, ESO Messenger 56, 31
Download Postscript reprint